Immigrants from North Macedonia vs Colville Currently Married
COMPARE
Immigrants from North Macedonia
Colville
Currently Married
Currently Married Comparison
Immigrants from North Macedonia
Colville
48.5%
CURRENTLY MARRIED
98.7/ 100
METRIC RATING
55th/ 347
METRIC RANK
43.4%
CURRENTLY MARRIED
0.1/ 100
METRIC RATING
275th/ 347
METRIC RANK
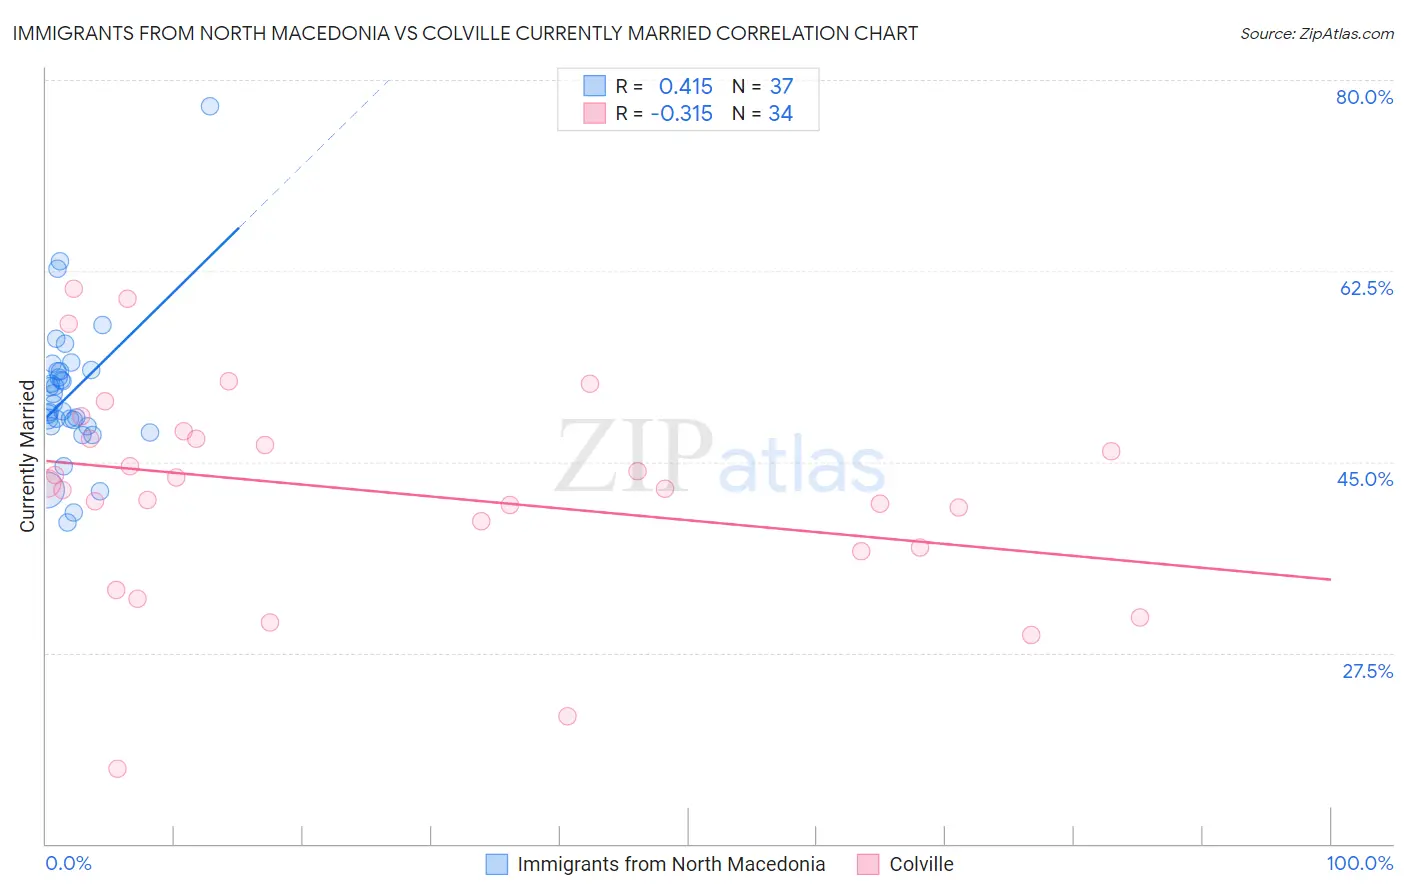
Immigrants from North Macedonia vs Colville Currently Married Correlation Chart
The statistical analysis conducted on geographies consisting of 74,297,543 people shows a moderate positive correlation between the proportion of Immigrants from North Macedonia and percentage of population currently married in the United States with a correlation coefficient (R) of 0.415 and weighted average of 48.5%. Similarly, the statistical analysis conducted on geographies consisting of 34,682,856 people shows a mild negative correlation between the proportion of Colville and percentage of population currently married in the United States with a correlation coefficient (R) of -0.315 and weighted average of 43.4%, a difference of 11.6%.
Currently Married Correlation Summary
| Measurement | Immigrants from North Macedonia | Colville |
| Minimum | 39.5% | 16.9% |
| Maximum | 77.6% | 60.9% |
| Range | 38.1% | 44.0% |
| Mean | 51.3% | 42.2% |
| Median | 50.3% | 42.8% |
| Interquartile 25% (IQ1) | 48.3% | 37.2% |
| Interquartile 75% (IQ3) | 53.4% | 47.1% |
| Interquartile Range (IQR) | 5.1% | 9.9% |
| Standard Deviation (Sample) | 6.8% | 9.7% |
| Standard Deviation (Population) | 6.7% | 9.5% |
Similar Demographics by Currently Married
Demographics Similar to Immigrants from North Macedonia by Currently Married
In terms of currently married, the demographic groups most similar to Immigrants from North Macedonia are Immigrants from Moldova (48.5%, a difference of 0.0%), Latvian (48.5%, a difference of 0.0%), Immigrants from Netherlands (48.5%, a difference of 0.030%), Immigrants from Austria (48.5%, a difference of 0.070%), and French (48.4%, a difference of 0.070%).
| Demographics | Rating | Rank | Currently Married |
| Austrians | 99.2 /100 | #48 | Exceptional 48.7% |
| Bhutanese | 99.1 /100 | #49 | Exceptional 48.6% |
| Iranians | 99.0 /100 | #50 | Exceptional 48.6% |
| Whites/Caucasians | 99.0 /100 | #51 | Exceptional 48.6% |
| Russians | 98.9 /100 | #52 | Exceptional 48.6% |
| Immigrants | Austria | 98.8 /100 | #53 | Exceptional 48.5% |
| Immigrants | Moldova | 98.7 /100 | #54 | Exceptional 48.5% |
| Immigrants | North Macedonia | 98.7 /100 | #55 | Exceptional 48.5% |
| Latvians | 98.7 /100 | #56 | Exceptional 48.5% |
| Immigrants | Netherlands | 98.6 /100 | #57 | Exceptional 48.5% |
| French | 98.6 /100 | #58 | Exceptional 48.4% |
| Immigrants | Ireland | 98.5 /100 | #59 | Exceptional 48.4% |
| Immigrants | Romania | 98.5 /100 | #60 | Exceptional 48.4% |
| Romanians | 98.5 /100 | #61 | Exceptional 48.4% |
| Asians | 98.5 /100 | #62 | Exceptional 48.4% |
Demographics Similar to Colville by Currently Married
In terms of currently married, the demographic groups most similar to Colville are Nigerian (43.4%, a difference of 0.020%), Sierra Leonean (43.4%, a difference of 0.030%), Yaqui (43.4%, a difference of 0.040%), Immigrants from Nigeria (43.4%, a difference of 0.040%), and Indonesian (43.5%, a difference of 0.080%).
| Demographics | Rating | Rank | Currently Married |
| Spanish American Indians | 0.1 /100 | #268 | Tragic 43.6% |
| Immigrants | Sudan | 0.1 /100 | #269 | Tragic 43.5% |
| Salvadorans | 0.1 /100 | #270 | Tragic 43.5% |
| Bermudans | 0.1 /100 | #271 | Tragic 43.5% |
| Indonesians | 0.1 /100 | #272 | Tragic 43.5% |
| Yaqui | 0.1 /100 | #273 | Tragic 43.4% |
| Nigerians | 0.1 /100 | #274 | Tragic 43.4% |
| Colville | 0.1 /100 | #275 | Tragic 43.4% |
| Sierra Leoneans | 0.1 /100 | #276 | Tragic 43.4% |
| Immigrants | Nigeria | 0.1 /100 | #277 | Tragic 43.4% |
| Central Americans | 0.0 /100 | #278 | Tragic 43.3% |
| Central American Indians | 0.0 /100 | #279 | Tragic 43.3% |
| Apache | 0.0 /100 | #280 | Tragic 43.2% |
| Chippewa | 0.0 /100 | #281 | Tragic 43.2% |
| Immigrants | Ecuador | 0.0 /100 | #282 | Tragic 43.2% |