Immigrants from North America vs Immigrants from Yemen Single Mother Households
COMPARE
Immigrants from North America
Immigrants from Yemen
Single Mother Households
Single Mother Households Comparison
Immigrants from North America
Immigrants from Yemen
5.6%
SINGLE MOTHER HOUSEHOLDS
98.3/ 100
METRIC RATING
74th/ 347
METRIC RANK
7.4%
SINGLE MOTHER HOUSEHOLDS
0.2/ 100
METRIC RATING
259th/ 347
METRIC RANK
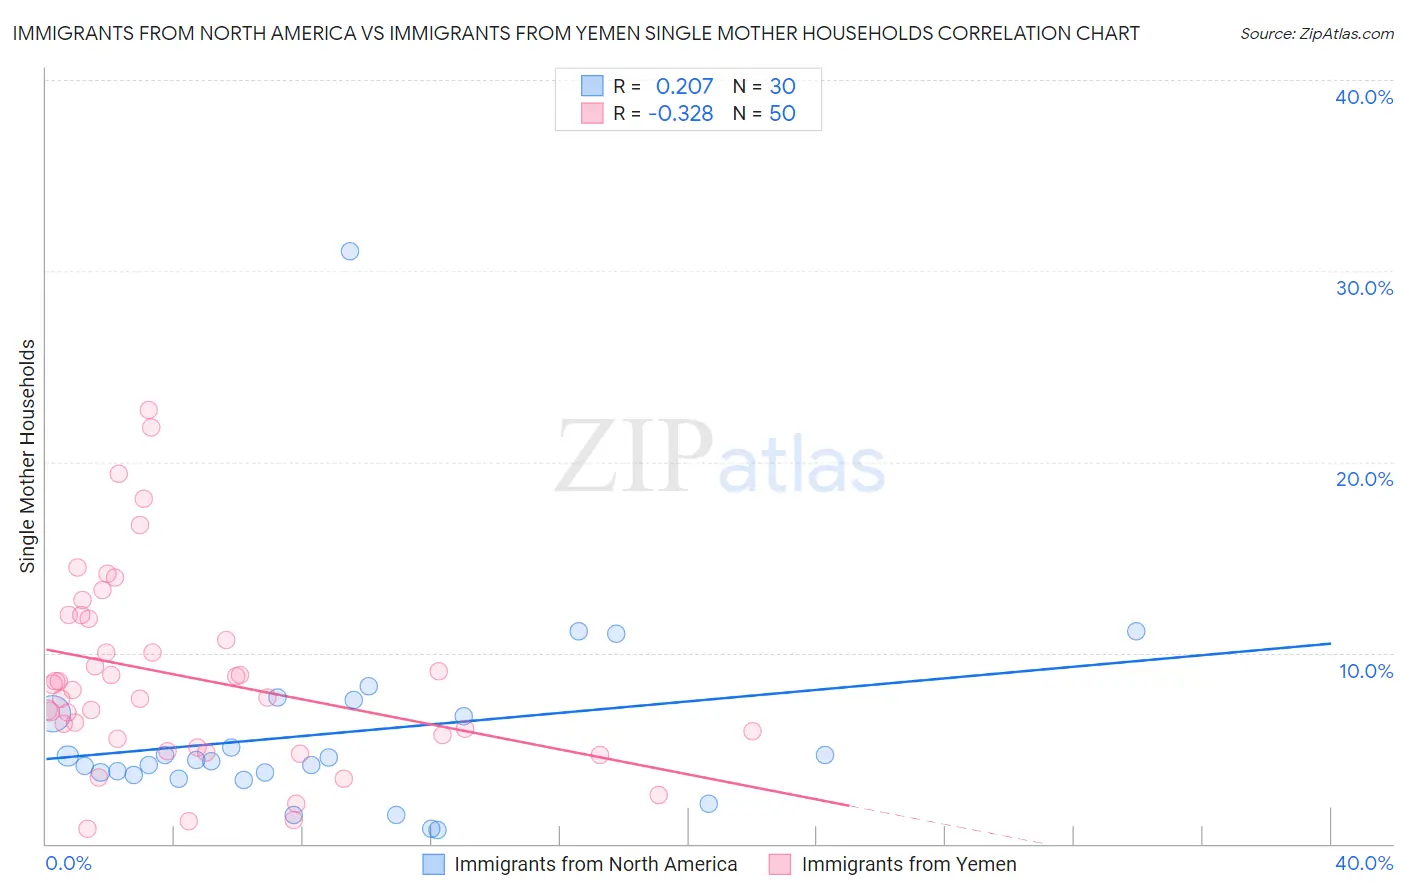
Immigrants from North America vs Immigrants from Yemen Single Mother Households Correlation Chart
The statistical analysis conducted on geographies consisting of 460,394,376 people shows a weak positive correlation between the proportion of Immigrants from North America and percentage of single mother households in the United States with a correlation coefficient (R) of 0.207 and weighted average of 5.6%. Similarly, the statistical analysis conducted on geographies consisting of 82,424,194 people shows a mild negative correlation between the proportion of Immigrants from Yemen and percentage of single mother households in the United States with a correlation coefficient (R) of -0.328 and weighted average of 7.4%, a difference of 32.0%.
Single Mother Households Correlation Summary
| Measurement | Immigrants from North America | Immigrants from Yemen |
| Minimum | 0.70% | 0.75% |
| Maximum | 31.0% | 22.7% |
| Range | 30.3% | 21.9% |
| Mean | 5.8% | 8.7% |
| Median | 4.4% | 7.9% |
| Interquartile 25% (IQ1) | 3.6% | 5.5% |
| Interquartile 75% (IQ3) | 6.8% | 11.8% |
| Interquartile Range (IQR) | 3.2% | 6.3% |
| Standard Deviation (Sample) | 5.5% | 5.1% |
| Standard Deviation (Population) | 5.4% | 5.0% |
Similar Demographics by Single Mother Households
Demographics Similar to Immigrants from North America by Single Mother Households
In terms of single mother households, the demographic groups most similar to Immigrants from North America are Immigrants from Asia (5.6%, a difference of 0.030%), Immigrants from Netherlands (5.6%, a difference of 0.090%), Slovene (5.6%, a difference of 0.14%), Immigrants from Kazakhstan (5.6%, a difference of 0.18%), and Immigrants from Eastern Europe (5.6%, a difference of 0.19%).
| Demographics | Rating | Rank | Single Mother Households |
| Italians | 98.5 /100 | #67 | Exceptional 5.6% |
| Immigrants | Bulgaria | 98.5 /100 | #68 | Exceptional 5.6% |
| Asians | 98.5 /100 | #69 | Exceptional 5.6% |
| Immigrants | Eastern Europe | 98.4 /100 | #70 | Exceptional 5.6% |
| Immigrants | Kazakhstan | 98.4 /100 | #71 | Exceptional 5.6% |
| Immigrants | Netherlands | 98.4 /100 | #72 | Exceptional 5.6% |
| Immigrants | Asia | 98.4 /100 | #73 | Exceptional 5.6% |
| Immigrants | North America | 98.3 /100 | #74 | Exceptional 5.6% |
| Slovenes | 98.3 /100 | #75 | Exceptional 5.6% |
| New Zealanders | 98.2 /100 | #76 | Exceptional 5.6% |
| Romanians | 98.1 /100 | #77 | Exceptional 5.6% |
| Swiss | 98.1 /100 | #78 | Exceptional 5.6% |
| Immigrants | Sri Lanka | 98.0 /100 | #79 | Exceptional 5.6% |
| Czechs | 97.9 /100 | #80 | Exceptional 5.6% |
| Immigrants | Moldova | 97.9 /100 | #81 | Exceptional 5.6% |
Demographics Similar to Immigrants from Yemen by Single Mother Households
In terms of single mother households, the demographic groups most similar to Immigrants from Yemen are Pueblo (7.4%, a difference of 0.020%), Alaska Native (7.4%, a difference of 0.040%), Immigrants from Zaire (7.4%, a difference of 0.040%), Japanese (7.4%, a difference of 0.060%), and Seminole (7.4%, a difference of 0.080%).
| Demographics | Rating | Rank | Single Mother Households |
| Alaskan Athabascans | 0.3 /100 | #252 | Tragic 7.3% |
| Cajuns | 0.3 /100 | #253 | Tragic 7.3% |
| Immigrants | Ecuador | 0.3 /100 | #254 | Tragic 7.3% |
| Mexican American Indians | 0.2 /100 | #255 | Tragic 7.4% |
| Seminole | 0.2 /100 | #256 | Tragic 7.4% |
| Alaska Natives | 0.2 /100 | #257 | Tragic 7.4% |
| Pueblo | 0.2 /100 | #258 | Tragic 7.4% |
| Immigrants | Yemen | 0.2 /100 | #259 | Tragic 7.4% |
| Immigrants | Zaire | 0.2 /100 | #260 | Tragic 7.4% |
| Japanese | 0.2 /100 | #261 | Tragic 7.4% |
| Immigrants | Somalia | 0.2 /100 | #262 | Tragic 7.4% |
| Immigrants | Nicaragua | 0.2 /100 | #263 | Tragic 7.4% |
| Yaqui | 0.1 /100 | #264 | Tragic 7.4% |
| Crow | 0.1 /100 | #265 | Tragic 7.4% |
| Nepalese | 0.1 /100 | #266 | Tragic 7.5% |