Immigrants from Nicaragua vs Menominee Single Mother Households
COMPARE
Immigrants from Nicaragua
Menominee
Single Mother Households
Single Mother Households Comparison
Immigrants from Nicaragua
Menominee
7.4%
SINGLE MOTHER HOUSEHOLDS
0.2/ 100
METRIC RATING
263rd/ 347
METRIC RANK
9.2%
SINGLE MOTHER HOUSEHOLDS
0.0/ 100
METRIC RATING
342nd/ 347
METRIC RANK
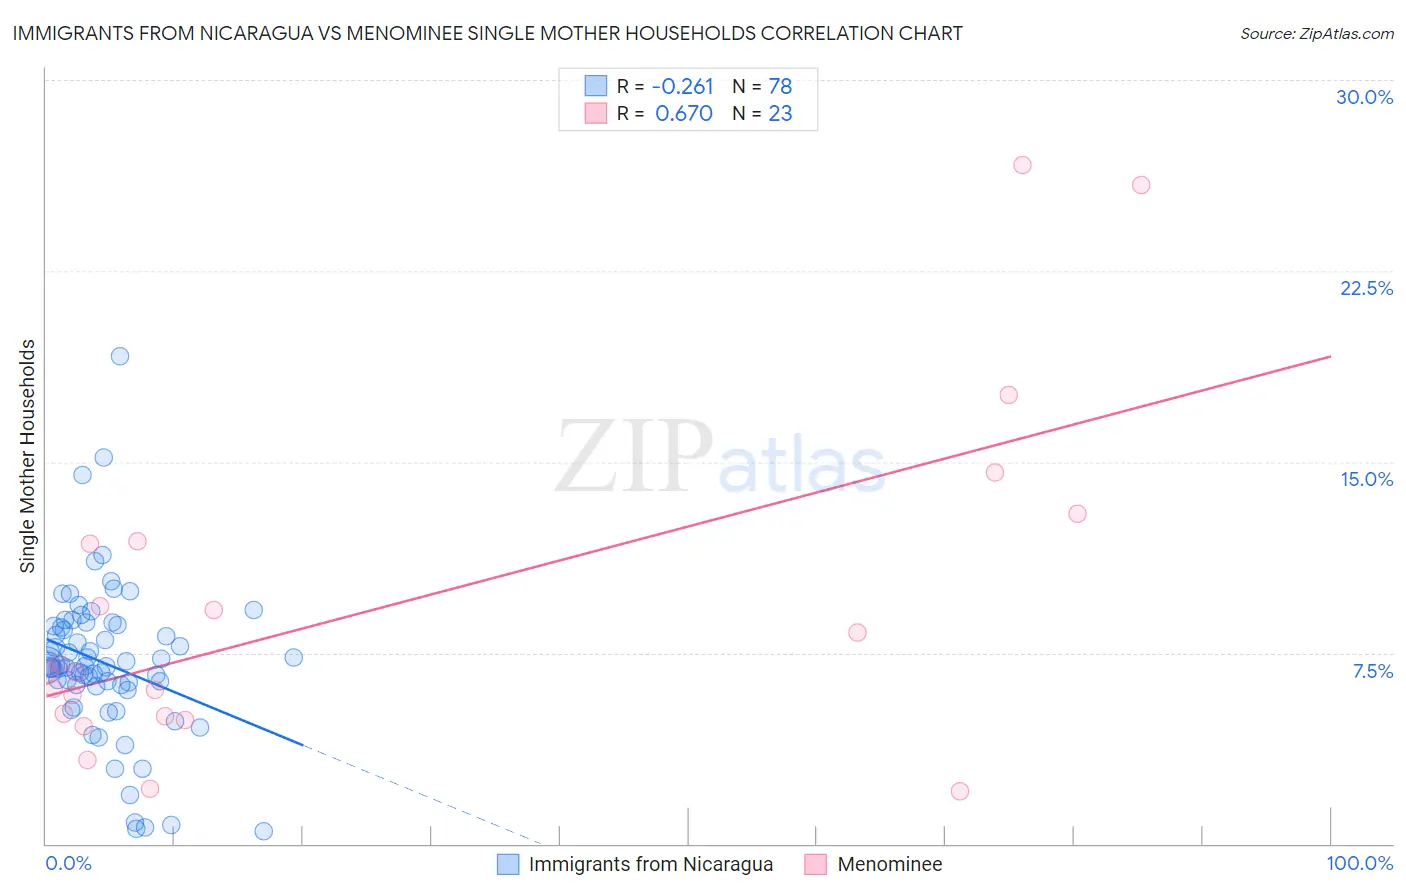
Immigrants from Nicaragua vs Menominee Single Mother Households Correlation Chart
The statistical analysis conducted on geographies consisting of 236,236,713 people shows a weak negative correlation between the proportion of Immigrants from Nicaragua and percentage of single mother households in the United States with a correlation coefficient (R) of -0.261 and weighted average of 7.4%. Similarly, the statistical analysis conducted on geographies consisting of 45,774,127 people shows a significant positive correlation between the proportion of Menominee and percentage of single mother households in the United States with a correlation coefficient (R) of 0.670 and weighted average of 9.2%, a difference of 23.3%.
Single Mother Households Correlation Summary
| Measurement | Immigrants from Nicaragua | Menominee |
| Minimum | 0.51% | 2.0% |
| Maximum | 19.1% | 26.7% |
| Range | 18.6% | 24.6% |
| Mean | 7.1% | 9.3% |
| Median | 7.0% | 6.7% |
| Interquartile 25% (IQ1) | 6.2% | 5.0% |
| Interquartile 75% (IQ3) | 8.5% | 11.9% |
| Interquartile Range (IQR) | 2.3% | 6.9% |
| Standard Deviation (Sample) | 3.0% | 6.6% |
| Standard Deviation (Population) | 3.0% | 6.5% |
Similar Demographics by Single Mother Households
Demographics Similar to Immigrants from Nicaragua by Single Mother Households
In terms of single mother households, the demographic groups most similar to Immigrants from Nicaragua are Yaqui (7.4%, a difference of 0.080%), Immigrants from Somalia (7.4%, a difference of 0.15%), Crow (7.4%, a difference of 0.25%), Japanese (7.4%, a difference of 0.35%), and Nepalese (7.5%, a difference of 0.35%).
| Demographics | Rating | Rank | Single Mother Households |
| Seminole | 0.2 /100 | #256 | Tragic 7.4% |
| Alaska Natives | 0.2 /100 | #257 | Tragic 7.4% |
| Pueblo | 0.2 /100 | #258 | Tragic 7.4% |
| Immigrants | Yemen | 0.2 /100 | #259 | Tragic 7.4% |
| Immigrants | Zaire | 0.2 /100 | #260 | Tragic 7.4% |
| Japanese | 0.2 /100 | #261 | Tragic 7.4% |
| Immigrants | Somalia | 0.2 /100 | #262 | Tragic 7.4% |
| Immigrants | Nicaragua | 0.2 /100 | #263 | Tragic 7.4% |
| Yaqui | 0.1 /100 | #264 | Tragic 7.4% |
| Crow | 0.1 /100 | #265 | Tragic 7.4% |
| Nepalese | 0.1 /100 | #266 | Tragic 7.5% |
| Blackfeet | 0.1 /100 | #267 | Tragic 7.5% |
| Indonesians | 0.1 /100 | #268 | Tragic 7.5% |
| Somalis | 0.1 /100 | #269 | Tragic 7.5% |
| Immigrants | Cuba | 0.1 /100 | #270 | Tragic 7.5% |
Demographics Similar to Menominee by Single Mother Households
In terms of single mother households, the demographic groups most similar to Menominee are Dominican (9.2%, a difference of 0.21%), Tohono O'odham (9.1%, a difference of 0.32%), Lumbee (9.1%, a difference of 0.68%), Black/African American (9.0%, a difference of 1.9%), and Cape Verdean (8.9%, a difference of 3.5%).
| Demographics | Rating | Rank | Single Mother Households |
| Liberians | 0.0 /100 | #333 | Tragic 8.6% |
| Immigrants | Liberia | 0.0 /100 | #334 | Tragic 8.7% |
| Immigrants | Dominica | 0.0 /100 | #335 | Tragic 8.7% |
| Puerto Ricans | 0.0 /100 | #336 | Tragic 8.7% |
| Navajo | 0.0 /100 | #337 | Tragic 8.8% |
| Cape Verdeans | 0.0 /100 | #338 | Tragic 8.9% |
| Blacks/African Americans | 0.0 /100 | #339 | Tragic 9.0% |
| Lumbee | 0.0 /100 | #340 | Tragic 9.1% |
| Tohono O'odham | 0.0 /100 | #341 | Tragic 9.1% |
| Menominee | 0.0 /100 | #342 | Tragic 9.2% |
| Dominicans | 0.0 /100 | #343 | Tragic 9.2% |
| Immigrants | Dominican Republic | 0.0 /100 | #344 | Tragic 9.5% |
| Immigrants | Cabo Verde | 0.0 /100 | #345 | Tragic 9.6% |
| Yuman | 0.0 /100 | #346 | Tragic 9.6% |
| Yup'ik | 0.0 /100 | #347 | Tragic 10.0% |