Immigrants from Nicaragua vs Arapaho Single Mother Households
COMPARE
Immigrants from Nicaragua
Arapaho
Single Mother Households
Single Mother Households Comparison
Immigrants from Nicaragua
Arapaho
7.4%
SINGLE MOTHER HOUSEHOLDS
0.2/ 100
METRIC RATING
263rd/ 347
METRIC RANK
7.1%
SINGLE MOTHER HOUSEHOLDS
1.0/ 100
METRIC RATING
237th/ 347
METRIC RANK
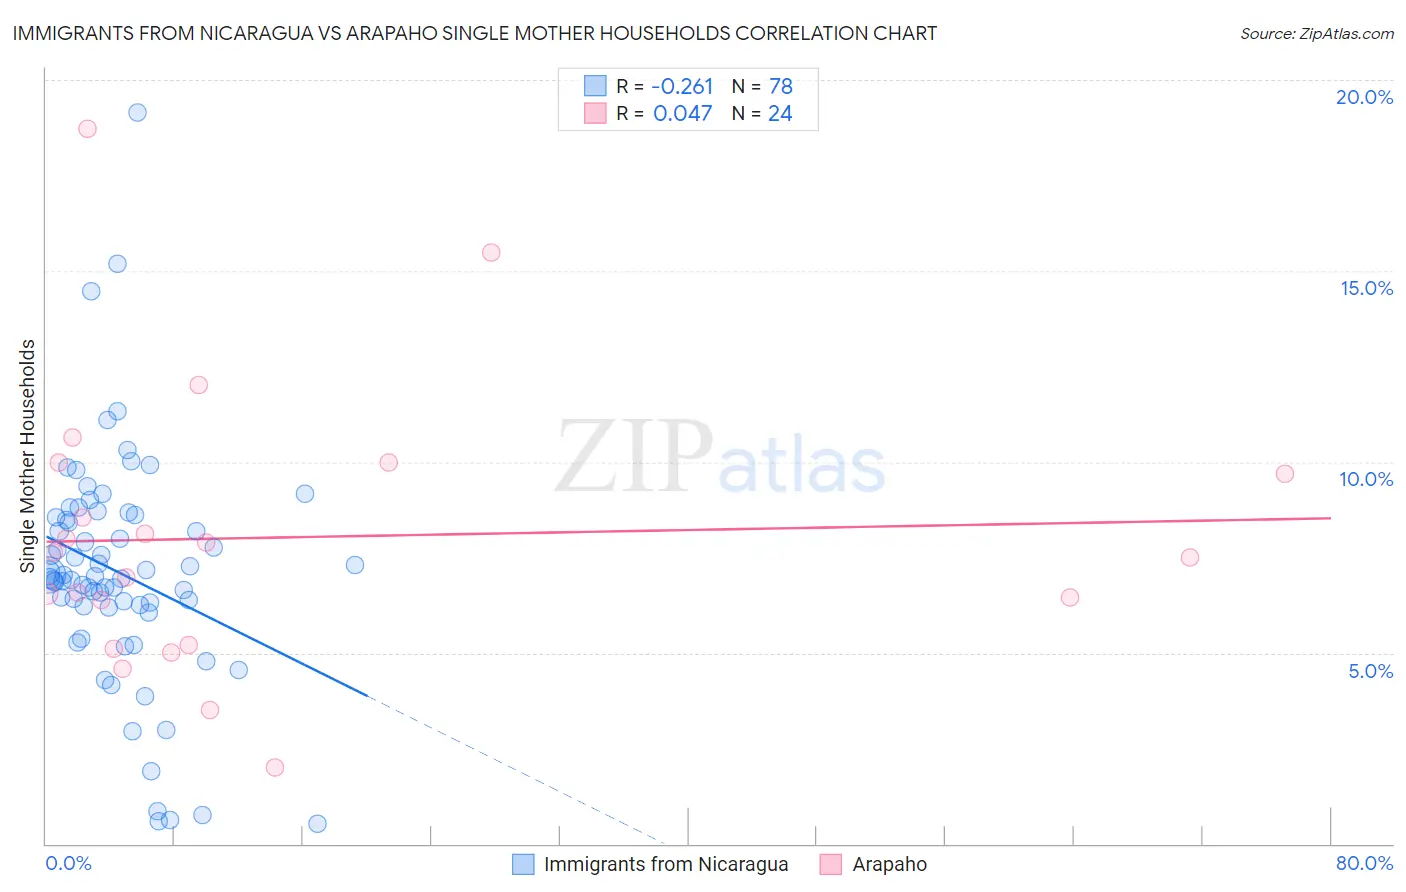
Immigrants from Nicaragua vs Arapaho Single Mother Households Correlation Chart
The statistical analysis conducted on geographies consisting of 236,236,713 people shows a weak negative correlation between the proportion of Immigrants from Nicaragua and percentage of single mother households in the United States with a correlation coefficient (R) of -0.261 and weighted average of 7.4%. Similarly, the statistical analysis conducted on geographies consisting of 29,770,033 people shows no correlation between the proportion of Arapaho and percentage of single mother households in the United States with a correlation coefficient (R) of 0.047 and weighted average of 7.1%, a difference of 4.5%.
Single Mother Households Correlation Summary
| Measurement | Immigrants from Nicaragua | Arapaho |
| Minimum | 0.51% | 2.0% |
| Maximum | 19.1% | 18.7% |
| Range | 18.6% | 16.7% |
| Mean | 7.1% | 8.0% |
| Median | 7.0% | 7.6% |
| Interquartile 25% (IQ1) | 6.2% | 5.8% |
| Interquartile 75% (IQ3) | 8.5% | 9.8% |
| Interquartile Range (IQR) | 2.3% | 4.0% |
| Standard Deviation (Sample) | 3.0% | 3.7% |
| Standard Deviation (Population) | 3.0% | 3.6% |
Similar Demographics by Single Mother Households
Demographics Similar to Immigrants from Nicaragua by Single Mother Households
In terms of single mother households, the demographic groups most similar to Immigrants from Nicaragua are Yaqui (7.4%, a difference of 0.080%), Immigrants from Somalia (7.4%, a difference of 0.15%), Crow (7.4%, a difference of 0.25%), Japanese (7.4%, a difference of 0.35%), and Nepalese (7.5%, a difference of 0.35%).
| Demographics | Rating | Rank | Single Mother Households |
| Seminole | 0.2 /100 | #256 | Tragic 7.4% |
| Alaska Natives | 0.2 /100 | #257 | Tragic 7.4% |
| Pueblo | 0.2 /100 | #258 | Tragic 7.4% |
| Immigrants | Yemen | 0.2 /100 | #259 | Tragic 7.4% |
| Immigrants | Zaire | 0.2 /100 | #260 | Tragic 7.4% |
| Japanese | 0.2 /100 | #261 | Tragic 7.4% |
| Immigrants | Somalia | 0.2 /100 | #262 | Tragic 7.4% |
| Immigrants | Nicaragua | 0.2 /100 | #263 | Tragic 7.4% |
| Yaqui | 0.1 /100 | #264 | Tragic 7.4% |
| Crow | 0.1 /100 | #265 | Tragic 7.4% |
| Nepalese | 0.1 /100 | #266 | Tragic 7.5% |
| Blackfeet | 0.1 /100 | #267 | Tragic 7.5% |
| Indonesians | 0.1 /100 | #268 | Tragic 7.5% |
| Somalis | 0.1 /100 | #269 | Tragic 7.5% |
| Immigrants | Cuba | 0.1 /100 | #270 | Tragic 7.5% |
Demographics Similar to Arapaho by Single Mother Households
In terms of single mother households, the demographic groups most similar to Arapaho are Ute (7.1%, a difference of 0.090%), Panamanian (7.1%, a difference of 0.14%), Kiowa (7.1%, a difference of 0.41%), Immigrants from Panama (7.2%, a difference of 0.73%), and Immigrants from Burma/Myanmar (7.0%, a difference of 0.88%).
| Demographics | Rating | Rank | Single Mother Households |
| Creek | 1.6 /100 | #230 | Tragic 7.0% |
| Spanish Americans | 1.6 /100 | #231 | Tragic 7.0% |
| Comanche | 1.5 /100 | #232 | Tragic 7.0% |
| Choctaw | 1.4 /100 | #233 | Tragic 7.0% |
| Chickasaw | 1.4 /100 | #234 | Tragic 7.0% |
| Immigrants | Burma/Myanmar | 1.4 /100 | #235 | Tragic 7.0% |
| Ute | 1.0 /100 | #236 | Tragic 7.1% |
| Arapaho | 1.0 /100 | #237 | Tragic 7.1% |
| Panamanians | 0.9 /100 | #238 | Tragic 7.1% |
| Kiowa | 0.8 /100 | #239 | Tragic 7.1% |
| Immigrants | Panama | 0.7 /100 | #240 | Tragic 7.2% |
| Immigrants | Portugal | 0.6 /100 | #241 | Tragic 7.2% |
| Fijians | 0.6 /100 | #242 | Tragic 7.2% |
| Ecuadorians | 0.6 /100 | #243 | Tragic 7.2% |
| Cubans | 0.6 /100 | #244 | Tragic 7.2% |