Immigrants from Nicaragua vs Ethiopian Single Mother Households
COMPARE
Immigrants from Nicaragua
Ethiopian
Single Mother Households
Single Mother Households Comparison
Immigrants from Nicaragua
Ethiopians
7.4%
SINGLE MOTHER HOUSEHOLDS
0.2/ 100
METRIC RATING
263rd/ 347
METRIC RANK
6.5%
SINGLE MOTHER HOUSEHOLDS
26.0/ 100
METRIC RATING
184th/ 347
METRIC RANK
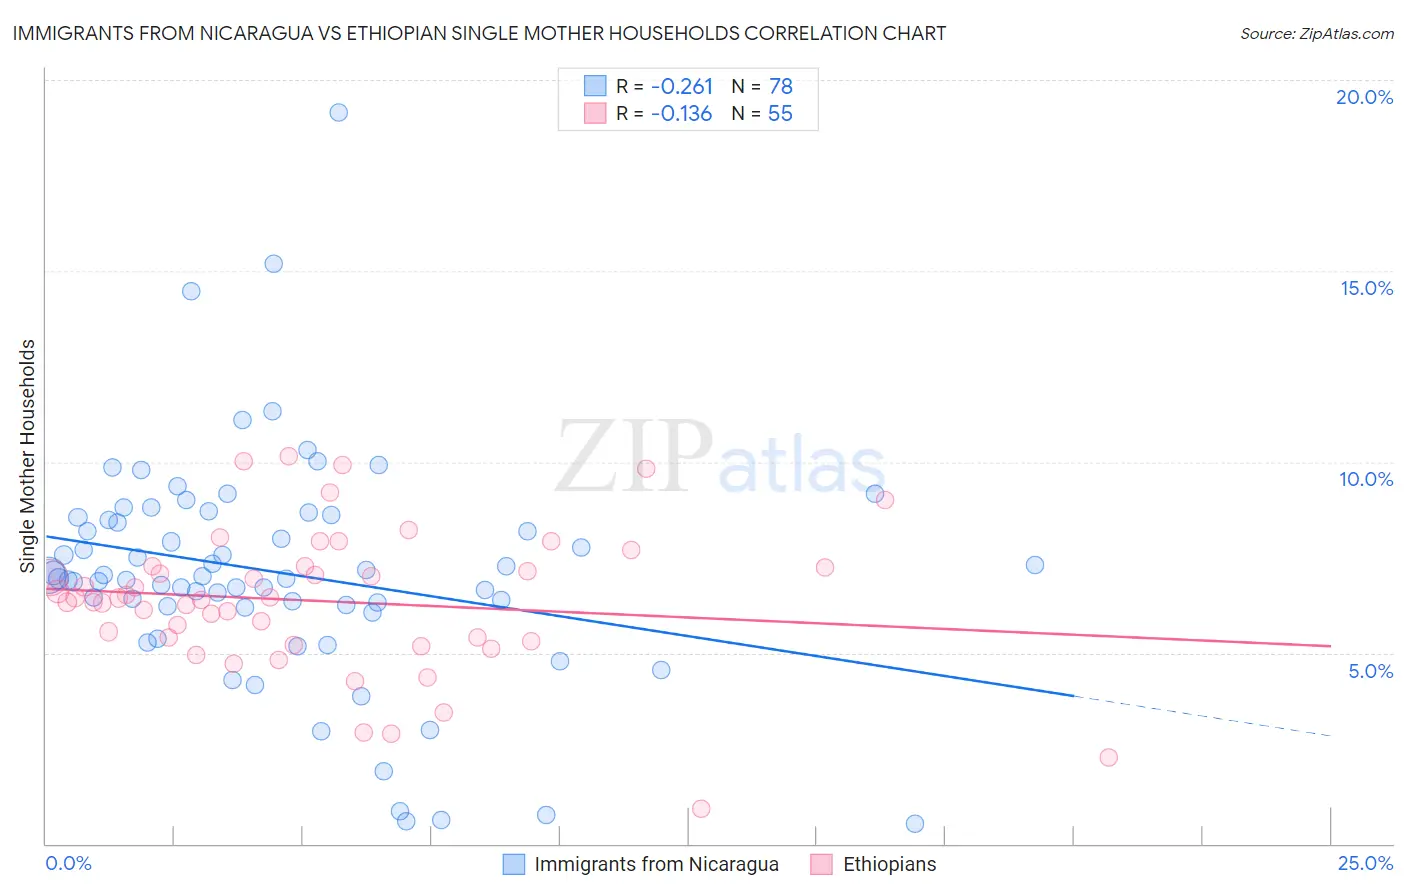
Immigrants from Nicaragua vs Ethiopian Single Mother Households Correlation Chart
The statistical analysis conducted on geographies consisting of 236,236,713 people shows a weak negative correlation between the proportion of Immigrants from Nicaragua and percentage of single mother households in the United States with a correlation coefficient (R) of -0.261 and weighted average of 7.4%. Similarly, the statistical analysis conducted on geographies consisting of 222,859,722 people shows a poor negative correlation between the proportion of Ethiopians and percentage of single mother households in the United States with a correlation coefficient (R) of -0.136 and weighted average of 6.5%, a difference of 14.5%.
Single Mother Households Correlation Summary
| Measurement | Immigrants from Nicaragua | Ethiopian |
| Minimum | 0.51% | 0.92% |
| Maximum | 19.1% | 10.1% |
| Range | 18.6% | 9.2% |
| Mean | 7.1% | 6.4% |
| Median | 7.0% | 6.4% |
| Interquartile 25% (IQ1) | 6.2% | 5.3% |
| Interquartile 75% (IQ3) | 8.5% | 7.3% |
| Interquartile Range (IQR) | 2.3% | 2.0% |
| Standard Deviation (Sample) | 3.0% | 1.9% |
| Standard Deviation (Population) | 3.0% | 1.9% |
Similar Demographics by Single Mother Households
Demographics Similar to Immigrants from Nicaragua by Single Mother Households
In terms of single mother households, the demographic groups most similar to Immigrants from Nicaragua are Yaqui (7.4%, a difference of 0.080%), Immigrants from Somalia (7.4%, a difference of 0.15%), Crow (7.4%, a difference of 0.25%), Japanese (7.4%, a difference of 0.35%), and Nepalese (7.5%, a difference of 0.35%).
| Demographics | Rating | Rank | Single Mother Households |
| Seminole | 0.2 /100 | #256 | Tragic 7.4% |
| Alaska Natives | 0.2 /100 | #257 | Tragic 7.4% |
| Pueblo | 0.2 /100 | #258 | Tragic 7.4% |
| Immigrants | Yemen | 0.2 /100 | #259 | Tragic 7.4% |
| Immigrants | Zaire | 0.2 /100 | #260 | Tragic 7.4% |
| Japanese | 0.2 /100 | #261 | Tragic 7.4% |
| Immigrants | Somalia | 0.2 /100 | #262 | Tragic 7.4% |
| Immigrants | Nicaragua | 0.2 /100 | #263 | Tragic 7.4% |
| Yaqui | 0.1 /100 | #264 | Tragic 7.4% |
| Crow | 0.1 /100 | #265 | Tragic 7.4% |
| Nepalese | 0.1 /100 | #266 | Tragic 7.5% |
| Blackfeet | 0.1 /100 | #267 | Tragic 7.5% |
| Indonesians | 0.1 /100 | #268 | Tragic 7.5% |
| Somalis | 0.1 /100 | #269 | Tragic 7.5% |
| Immigrants | Cuba | 0.1 /100 | #270 | Tragic 7.5% |
Demographics Similar to Ethiopians by Single Mother Households
In terms of single mother households, the demographic groups most similar to Ethiopians are Ugandan (6.5%, a difference of 0.060%), Costa Rican (6.5%, a difference of 0.17%), Immigrants from Afghanistan (6.5%, a difference of 0.19%), Spaniard (6.5%, a difference of 0.24%), and Ottawa (6.5%, a difference of 0.32%).
| Demographics | Rating | Rank | Single Mother Households |
| Osage | 43.0 /100 | #177 | Average 6.4% |
| Portuguese | 40.0 /100 | #178 | Fair 6.4% |
| Hmong | 39.8 /100 | #179 | Fair 6.4% |
| Immigrants | Nepal | 36.1 /100 | #180 | Fair 6.4% |
| Spanish | 33.4 /100 | #181 | Fair 6.4% |
| South American Indians | 33.4 /100 | #182 | Fair 6.4% |
| Spaniards | 27.8 /100 | #183 | Fair 6.5% |
| Ethiopians | 26.0 /100 | #184 | Fair 6.5% |
| Ugandans | 25.6 /100 | #185 | Fair 6.5% |
| Costa Ricans | 24.8 /100 | #186 | Fair 6.5% |
| Immigrants | Afghanistan | 24.7 /100 | #187 | Fair 6.5% |
| Ottawa | 23.8 /100 | #188 | Fair 6.5% |
| Delaware | 23.3 /100 | #189 | Fair 6.5% |
| Peruvians | 21.6 /100 | #190 | Fair 6.5% |
| Samoans | 21.2 /100 | #191 | Fair 6.5% |