Panamanian vs Arapaho Single Mother Households
COMPARE
Panamanian
Arapaho
Single Mother Households
Single Mother Households Comparison
Panamanians
Arapaho
7.1%
SINGLE MOTHER HOUSEHOLDS
0.9/ 100
METRIC RATING
238th/ 347
METRIC RANK
7.1%
SINGLE MOTHER HOUSEHOLDS
1.0/ 100
METRIC RATING
237th/ 347
METRIC RANK
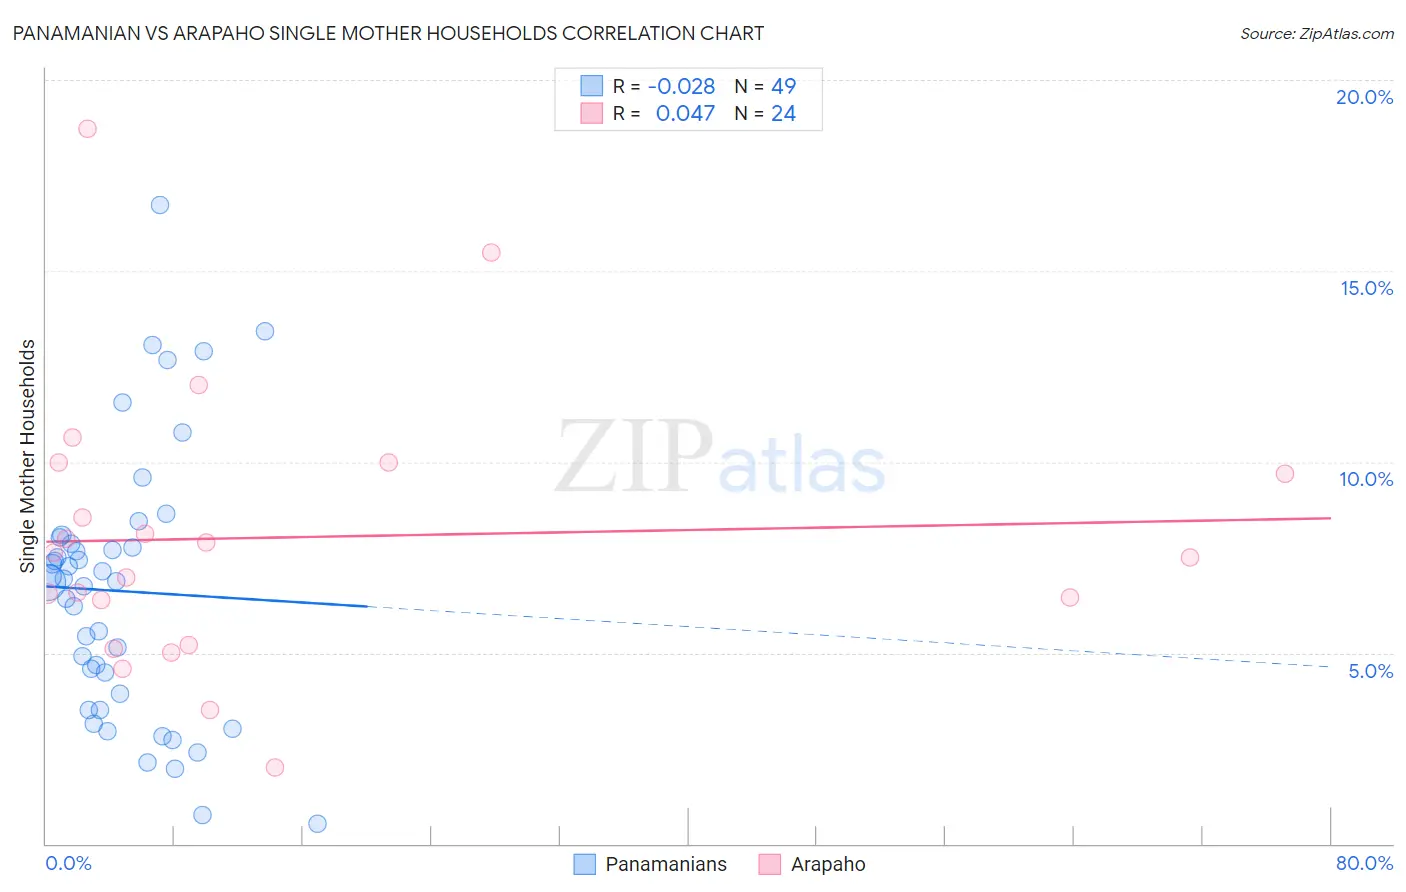
Panamanian vs Arapaho Single Mother Households Correlation Chart
The statistical analysis conducted on geographies consisting of 280,762,519 people shows no correlation between the proportion of Panamanians and percentage of single mother households in the United States with a correlation coefficient (R) of -0.028 and weighted average of 7.1%. Similarly, the statistical analysis conducted on geographies consisting of 29,770,033 people shows no correlation between the proportion of Arapaho and percentage of single mother households in the United States with a correlation coefficient (R) of 0.047 and weighted average of 7.1%, a difference of 0.14%.
Single Mother Households Correlation Summary
| Measurement | Panamanian | Arapaho |
| Minimum | 0.51% | 2.0% |
| Maximum | 16.7% | 18.7% |
| Range | 16.2% | 16.7% |
| Mean | 6.6% | 8.0% |
| Median | 6.9% | 7.6% |
| Interquartile 25% (IQ1) | 3.7% | 5.8% |
| Interquartile 75% (IQ3) | 7.9% | 9.8% |
| Interquartile Range (IQR) | 4.2% | 4.0% |
| Standard Deviation (Sample) | 3.5% | 3.7% |
| Standard Deviation (Population) | 3.5% | 3.6% |
Demographics Similar to Panamanians and Arapaho by Single Mother Households
In terms of single mother households, the demographic groups most similar to Panamanians are Ute (7.1%, a difference of 0.23%), Kiowa (7.1%, a difference of 0.27%), Immigrants from Panama (7.2%, a difference of 0.59%), Immigrants from Portugal (7.2%, a difference of 0.94%), and Immigrants from Burma/Myanmar (7.0%, a difference of 1.0%). Similarly, the demographic groups most similar to Arapaho are Ute (7.1%, a difference of 0.090%), Kiowa (7.1%, a difference of 0.41%), Immigrants from Panama (7.2%, a difference of 0.73%), Immigrants from Burma/Myanmar (7.0%, a difference of 0.88%), and Chickasaw (7.0%, a difference of 0.95%).
| Demographics | Rating | Rank | Single Mother Households |
| Kenyans | 2.3 /100 | #227 | Tragic 7.0% |
| Iroquois | 2.2 /100 | #228 | Tragic 7.0% |
| Immigrants | Kenya | 2.1 /100 | #229 | Tragic 7.0% |
| Creek | 1.6 /100 | #230 | Tragic 7.0% |
| Spanish Americans | 1.6 /100 | #231 | Tragic 7.0% |
| Comanche | 1.5 /100 | #232 | Tragic 7.0% |
| Choctaw | 1.4 /100 | #233 | Tragic 7.0% |
| Chickasaw | 1.4 /100 | #234 | Tragic 7.0% |
| Immigrants | Burma/Myanmar | 1.4 /100 | #235 | Tragic 7.0% |
| Ute | 1.0 /100 | #236 | Tragic 7.1% |
| Arapaho | 1.0 /100 | #237 | Tragic 7.1% |
| Panamanians | 0.9 /100 | #238 | Tragic 7.1% |
| Kiowa | 0.8 /100 | #239 | Tragic 7.1% |
| Immigrants | Panama | 0.7 /100 | #240 | Tragic 7.2% |
| Immigrants | Portugal | 0.6 /100 | #241 | Tragic 7.2% |
| Fijians | 0.6 /100 | #242 | Tragic 7.2% |
| Ecuadorians | 0.6 /100 | #243 | Tragic 7.2% |
| Cubans | 0.6 /100 | #244 | Tragic 7.2% |
| Immigrants | Cambodia | 0.5 /100 | #245 | Tragic 7.2% |
| Nicaraguans | 0.5 /100 | #246 | Tragic 7.2% |
| Dutch West Indians | 0.4 /100 | #247 | Tragic 7.3% |