Immigrants from Netherlands vs Immigrants from Hungary Kindergarten
COMPARE
Immigrants from Netherlands
Immigrants from Hungary
Kindergarten
Kindergarten Comparison
Immigrants from Netherlands
Immigrants from Hungary
98.3%
KINDERGARTEN
99.3/ 100
METRIC RATING
74th/ 347
METRIC RANK
98.1%
KINDERGARTEN
89.1/ 100
METRIC RATING
136th/ 347
METRIC RANK
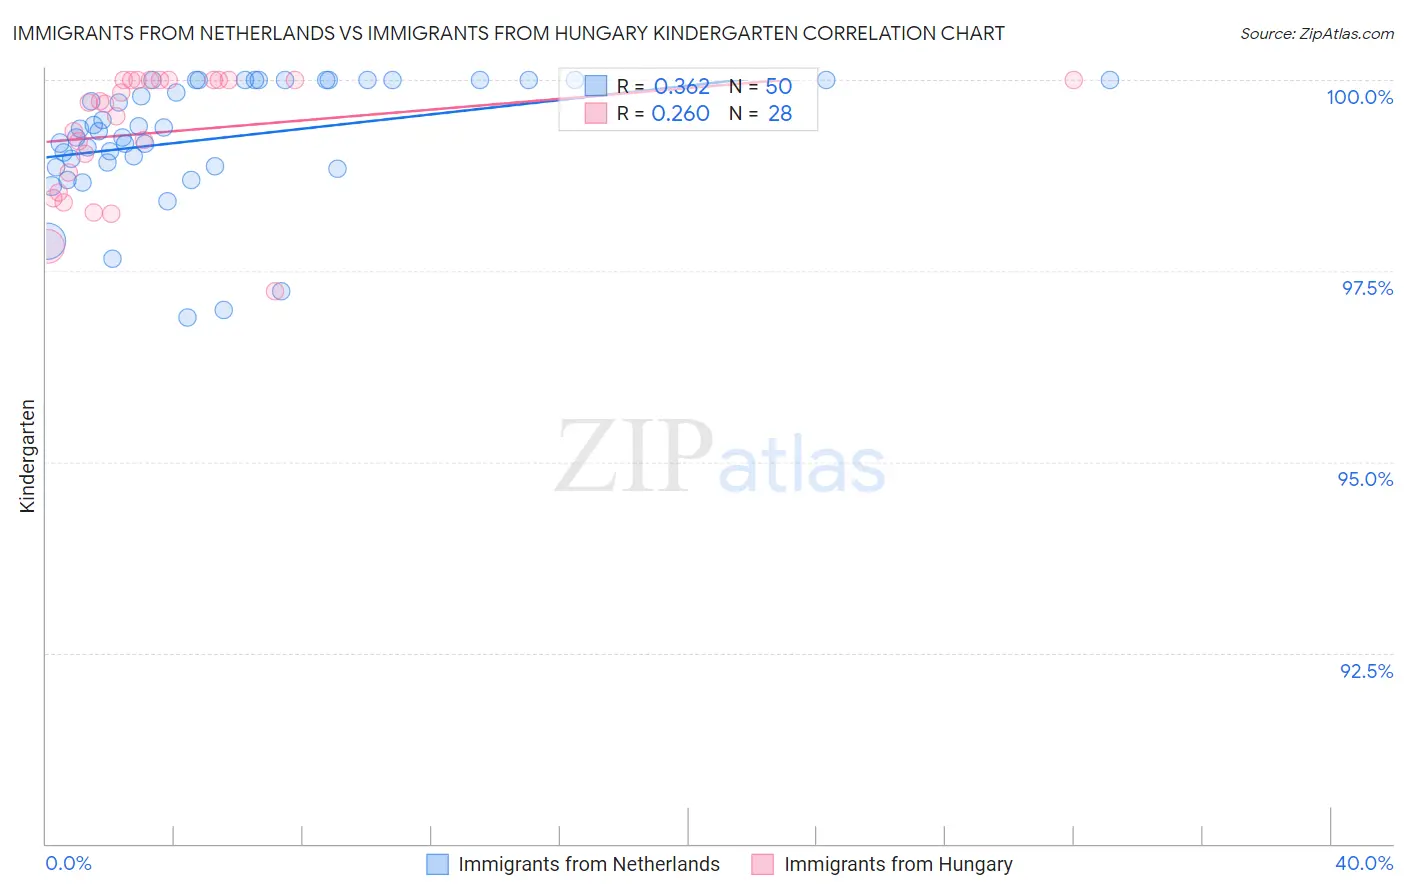
Immigrants from Netherlands vs Immigrants from Hungary Kindergarten Correlation Chart
The statistical analysis conducted on geographies consisting of 237,869,934 people shows a mild positive correlation between the proportion of Immigrants from Netherlands and percentage of population with at least kindergarten education in the United States with a correlation coefficient (R) of 0.362 and weighted average of 98.3%. Similarly, the statistical analysis conducted on geographies consisting of 195,707,305 people shows a weak positive correlation between the proportion of Immigrants from Hungary and percentage of population with at least kindergarten education in the United States with a correlation coefficient (R) of 0.260 and weighted average of 98.1%, a difference of 0.22%.
Kindergarten Correlation Summary
| Measurement | Immigrants from Netherlands | Immigrants from Hungary |
| Minimum | 96.9% | 97.2% |
| Maximum | 100.0% | 100.0% |
| Range | 3.1% | 2.8% |
| Mean | 99.2% | 99.3% |
| Median | 99.3% | 99.7% |
| Interquartile 25% (IQ1) | 98.9% | 98.7% |
| Interquartile 75% (IQ3) | 100.0% | 100.0% |
| Interquartile Range (IQR) | 1.1% | 1.3% |
| Standard Deviation (Sample) | 0.81% | 0.80% |
| Standard Deviation (Population) | 0.80% | 0.79% |
Similar Demographics by Kindergarten
Demographics Similar to Immigrants from Netherlands by Kindergarten
In terms of kindergarten, the demographic groups most similar to Immigrants from Netherlands are Cherokee (98.3%, a difference of 0.0%), Cajun (98.3%, a difference of 0.010%), Immigrants from England (98.3%, a difference of 0.010%), Delaware (98.3%, a difference of 0.010%), and Shoshone (98.3%, a difference of 0.010%).
| Demographics | Rating | Rank | Kindergarten |
| Canadians | 99.6 /100 | #67 | Exceptional 98.4% |
| Immigrants | Northern Europe | 99.6 /100 | #68 | Exceptional 98.4% |
| Immigrants | Austria | 99.6 /100 | #69 | Exceptional 98.4% |
| Russians | 99.6 /100 | #70 | Exceptional 98.4% |
| Chickasaw | 99.6 /100 | #71 | Exceptional 98.4% |
| Serbians | 99.6 /100 | #72 | Exceptional 98.4% |
| Cajuns | 99.4 /100 | #73 | Exceptional 98.3% |
| Immigrants | Netherlands | 99.3 /100 | #74 | Exceptional 98.3% |
| Cherokee | 99.3 /100 | #75 | Exceptional 98.3% |
| Immigrants | England | 99.3 /100 | #76 | Exceptional 98.3% |
| Delaware | 99.3 /100 | #77 | Exceptional 98.3% |
| Shoshone | 99.2 /100 | #78 | Exceptional 98.3% |
| Immigrants | Belgium | 99.2 /100 | #79 | Exceptional 98.3% |
| Immigrants | Lithuania | 99.2 /100 | #80 | Exceptional 98.3% |
| Icelanders | 99.2 /100 | #81 | Exceptional 98.3% |
Demographics Similar to Immigrants from Hungary by Kindergarten
In terms of kindergarten, the demographic groups most similar to Immigrants from Hungary are Immigrants from Bulgaria (98.1%, a difference of 0.0%), Immigrants from Kuwait (98.1%, a difference of 0.0%), Immigrants from Europe (98.1%, a difference of 0.010%), Blackfeet (98.1%, a difference of 0.010%), and Immigrants from Romania (98.1%, a difference of 0.010%).
| Demographics | Rating | Rank | Kindergarten |
| Seminole | 91.5 /100 | #129 | Exceptional 98.1% |
| Immigrants | Croatia | 91.2 /100 | #130 | Exceptional 98.1% |
| Cambodians | 91.2 /100 | #131 | Exceptional 98.1% |
| Spaniards | 91.0 /100 | #132 | Exceptional 98.1% |
| Immigrants | Europe | 90.4 /100 | #133 | Exceptional 98.1% |
| Immigrants | Bulgaria | 89.4 /100 | #134 | Excellent 98.1% |
| Immigrants | Kuwait | 89.2 /100 | #135 | Excellent 98.1% |
| Immigrants | Hungary | 89.1 /100 | #136 | Excellent 98.1% |
| Blackfeet | 87.8 /100 | #137 | Excellent 98.1% |
| Immigrants | Romania | 87.7 /100 | #138 | Excellent 98.1% |
| Israelis | 87.7 /100 | #139 | Excellent 98.1% |
| Palestinians | 83.6 /100 | #140 | Excellent 98.1% |
| Marshallese | 83.0 /100 | #141 | Excellent 98.1% |
| Immigrants | Turkey | 82.8 /100 | #142 | Excellent 98.1% |
| Burmese | 81.5 /100 | #143 | Excellent 98.1% |