Dominican vs Immigrants from Hungary Single Mother Households
COMPARE
Dominican
Immigrants from Hungary
Single Mother Households
Single Mother Households Comparison
Dominicans
Immigrants from Hungary
9.2%
SINGLE MOTHER HOUSEHOLDS
0.0/ 100
METRIC RATING
343rd/ 347
METRIC RANK
5.7%
SINGLE MOTHER HOUSEHOLDS
97.8/ 100
METRIC RATING
83rd/ 347
METRIC RANK
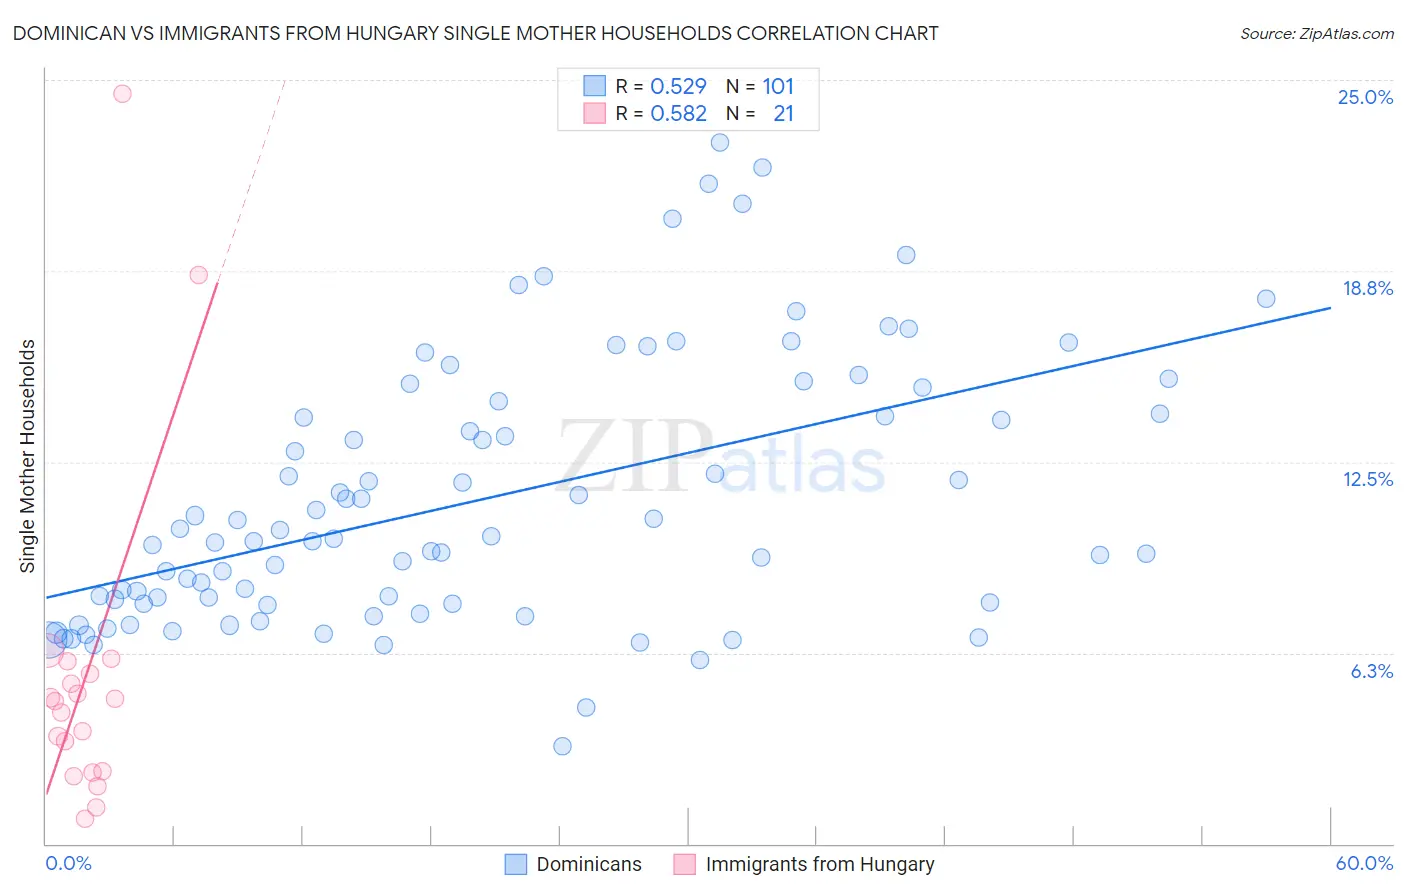
Dominican vs Immigrants from Hungary Single Mother Households Correlation Chart
The statistical analysis conducted on geographies consisting of 354,173,305 people shows a substantial positive correlation between the proportion of Dominicans and percentage of single mother households in the United States with a correlation coefficient (R) of 0.529 and weighted average of 9.2%. Similarly, the statistical analysis conducted on geographies consisting of 195,293,464 people shows a substantial positive correlation between the proportion of Immigrants from Hungary and percentage of single mother households in the United States with a correlation coefficient (R) of 0.582 and weighted average of 5.7%, a difference of 62.2%.
Single Mother Households Correlation Summary
| Measurement | Dominican | Immigrants from Hungary |
| Minimum | 3.2% | 0.83% |
| Maximum | 23.0% | 24.6% |
| Range | 19.8% | 23.7% |
| Mean | 11.3% | 5.6% |
| Median | 10.0% | 4.7% |
| Interquartile 25% (IQ1) | 7.9% | 2.4% |
| Interquartile 75% (IQ3) | 14.3% | 5.8% |
| Interquartile Range (IQR) | 6.4% | 3.4% |
| Standard Deviation (Sample) | 4.3% | 5.6% |
| Standard Deviation (Population) | 4.3% | 5.5% |
Similar Demographics by Single Mother Households
Demographics Similar to Dominicans by Single Mother Households
In terms of single mother households, the demographic groups most similar to Dominicans are Menominee (9.2%, a difference of 0.21%), Tohono O'odham (9.1%, a difference of 0.53%), Lumbee (9.1%, a difference of 0.89%), Black/African American (9.0%, a difference of 2.1%), and Immigrants from Dominican Republic (9.5%, a difference of 3.5%).
| Demographics | Rating | Rank | Single Mother Households |
| Liberians | 0.0 /100 | #333 | Tragic 8.6% |
| Immigrants | Liberia | 0.0 /100 | #334 | Tragic 8.7% |
| Immigrants | Dominica | 0.0 /100 | #335 | Tragic 8.7% |
| Puerto Ricans | 0.0 /100 | #336 | Tragic 8.7% |
| Navajo | 0.0 /100 | #337 | Tragic 8.8% |
| Cape Verdeans | 0.0 /100 | #338 | Tragic 8.9% |
| Blacks/African Americans | 0.0 /100 | #339 | Tragic 9.0% |
| Lumbee | 0.0 /100 | #340 | Tragic 9.1% |
| Tohono O'odham | 0.0 /100 | #341 | Tragic 9.1% |
| Menominee | 0.0 /100 | #342 | Tragic 9.2% |
| Dominicans | 0.0 /100 | #343 | Tragic 9.2% |
| Immigrants | Dominican Republic | 0.0 /100 | #344 | Tragic 9.5% |
| Immigrants | Cabo Verde | 0.0 /100 | #345 | Tragic 9.6% |
| Yuman | 0.0 /100 | #346 | Tragic 9.6% |
| Yup'ik | 0.0 /100 | #347 | Tragic 10.0% |
Demographics Similar to Immigrants from Hungary by Single Mother Households
In terms of single mother households, the demographic groups most similar to Immigrants from Hungary are Immigrants from Malaysia (5.7%, a difference of 0.030%), Carpatho Rusyn (5.7%, a difference of 0.080%), Hungarian (5.7%, a difference of 0.23%), Czech (5.6%, a difference of 0.24%), and Immigrants from Moldova (5.6%, a difference of 0.24%).
| Demographics | Rating | Rank | Single Mother Households |
| New Zealanders | 98.2 /100 | #76 | Exceptional 5.6% |
| Romanians | 98.1 /100 | #77 | Exceptional 5.6% |
| Swiss | 98.1 /100 | #78 | Exceptional 5.6% |
| Immigrants | Sri Lanka | 98.0 /100 | #79 | Exceptional 5.6% |
| Czechs | 97.9 /100 | #80 | Exceptional 5.6% |
| Immigrants | Moldova | 97.9 /100 | #81 | Exceptional 5.6% |
| Immigrants | Malaysia | 97.8 /100 | #82 | Exceptional 5.7% |
| Immigrants | Hungary | 97.8 /100 | #83 | Exceptional 5.7% |
| Carpatho Rusyns | 97.7 /100 | #84 | Exceptional 5.7% |
| Hungarians | 97.6 /100 | #85 | Exceptional 5.7% |
| Finns | 97.6 /100 | #86 | Exceptional 5.7% |
| Immigrants | Turkey | 97.5 /100 | #87 | Exceptional 5.7% |
| Israelis | 97.4 /100 | #88 | Exceptional 5.7% |
| Ukrainians | 97.2 /100 | #89 | Exceptional 5.7% |
| Immigrants | Indonesia | 97.2 /100 | #90 | Exceptional 5.7% |