Immigrants from Switzerland vs Sioux Family Households
COMPARE
Immigrants from Switzerland
Sioux
Family Households
Family Households Comparison
Immigrants from Switzerland
Sioux
61.6%
FAMILY HOUSEHOLDS
0.0/ 100
METRIC RATING
325th/ 347
METRIC RANK
64.6%
FAMILY HOUSEHOLDS
76.3/ 100
METRIC RATING
149th/ 347
METRIC RANK
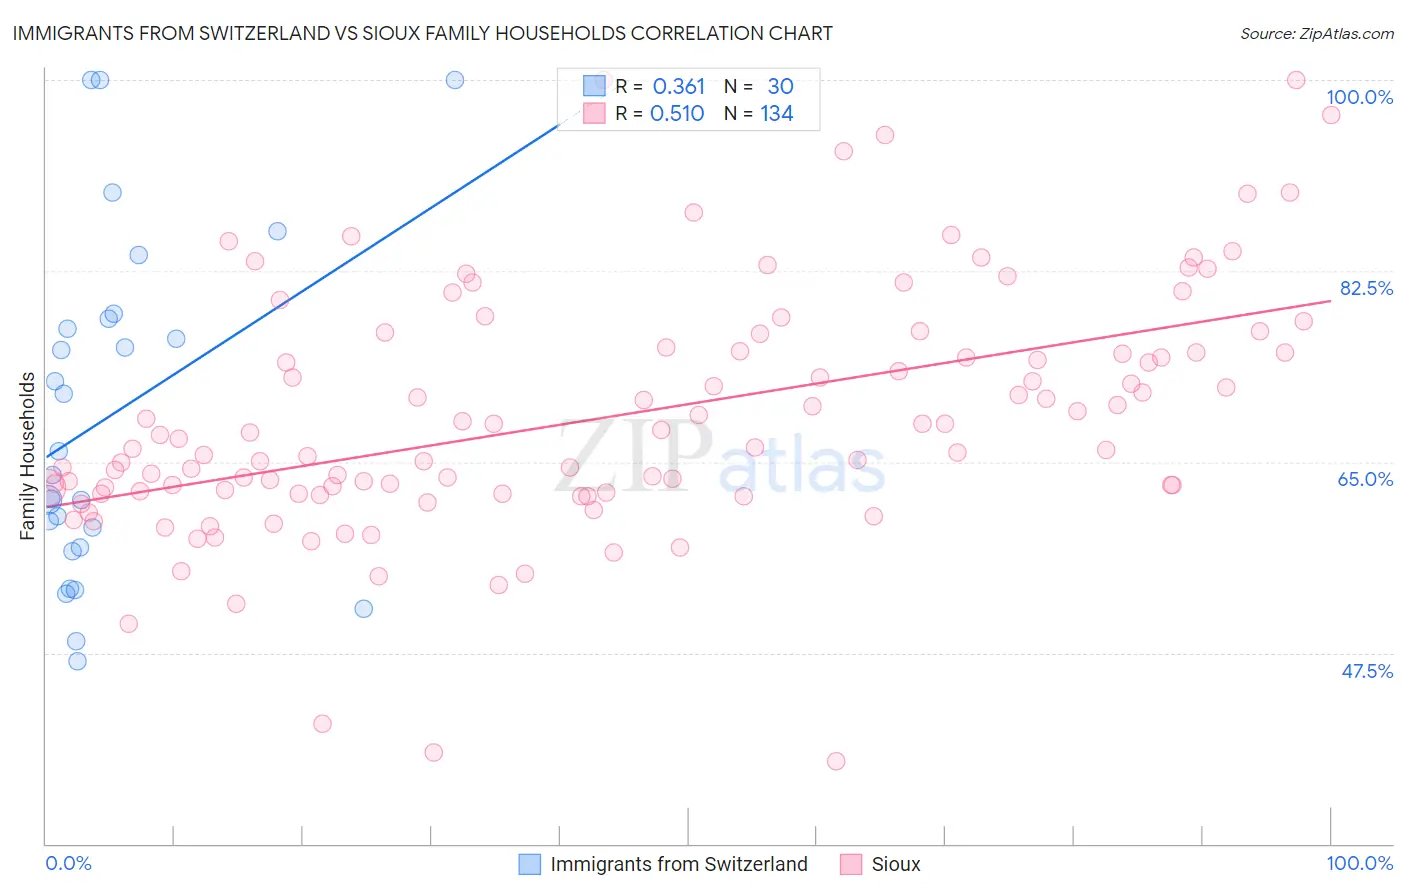
Immigrants from Switzerland vs Sioux Family Households Correlation Chart
The statistical analysis conducted on geographies consisting of 148,072,536 people shows a mild positive correlation between the proportion of Immigrants from Switzerland and percentage of family households in the United States with a correlation coefficient (R) of 0.361 and weighted average of 61.6%. Similarly, the statistical analysis conducted on geographies consisting of 234,114,463 people shows a substantial positive correlation between the proportion of Sioux and percentage of family households in the United States with a correlation coefficient (R) of 0.510 and weighted average of 64.6%, a difference of 4.8%.
Family Households Correlation Summary
| Measurement | Immigrants from Switzerland | Sioux |
| Minimum | 46.8% | 37.6% |
| Maximum | 100.0% | 100.0% |
| Range | 53.2% | 62.4% |
| Mean | 69.2% | 69.1% |
| Median | 64.9% | 66.7% |
| Interquartile 25% (IQ1) | 57.1% | 62.2% |
| Interquartile 75% (IQ3) | 78.1% | 75.2% |
| Interquartile Range (IQR) | 21.0% | 13.0% |
| Standard Deviation (Sample) | 15.5% | 11.2% |
| Standard Deviation (Population) | 15.2% | 11.1% |
Similar Demographics by Family Households
Demographics Similar to Immigrants from Switzerland by Family Households
In terms of family households, the demographic groups most similar to Immigrants from Switzerland are Immigrants from West Indies (61.6%, a difference of 0.010%), Immigrants from Serbia (61.6%, a difference of 0.020%), Tlingit-Haida (61.6%, a difference of 0.020%), Alsatian (61.7%, a difference of 0.11%), and Ugandan (61.7%, a difference of 0.17%).
| Demographics | Rating | Rank | Family Households |
| Alaskan Athabascans | 0.0 /100 | #318 | Tragic 61.8% |
| Cape Verdeans | 0.0 /100 | #319 | Tragic 61.8% |
| Ugandans | 0.0 /100 | #320 | Tragic 61.7% |
| Alsatians | 0.0 /100 | #321 | Tragic 61.7% |
| Immigrants | Serbia | 0.0 /100 | #322 | Tragic 61.6% |
| Tlingit-Haida | 0.0 /100 | #323 | Tragic 61.6% |
| Immigrants | West Indies | 0.0 /100 | #324 | Tragic 61.6% |
| Immigrants | Switzerland | 0.0 /100 | #325 | Tragic 61.6% |
| Indonesians | 0.0 /100 | #326 | Tragic 61.5% |
| Blacks/African Americans | 0.0 /100 | #327 | Tragic 61.5% |
| Kiowa | 0.0 /100 | #328 | Tragic 61.4% |
| Cambodians | 0.0 /100 | #329 | Tragic 61.4% |
| Immigrants | Australia | 0.0 /100 | #330 | Tragic 61.3% |
| Immigrants | France | 0.0 /100 | #331 | Tragic 61.3% |
| Ethiopians | 0.0 /100 | #332 | Tragic 61.2% |
Demographics Similar to Sioux by Family Households
In terms of family households, the demographic groups most similar to Sioux are Immigrants from Chile (64.6%, a difference of 0.0%), Delaware (64.6%, a difference of 0.0%), Immigrants from Romania (64.6%, a difference of 0.010%), Romanian (64.5%, a difference of 0.020%), and Syrian (64.5%, a difference of 0.020%).
| Demographics | Rating | Rank | Family Households |
| Pakistanis | 84.0 /100 | #142 | Excellent 64.7% |
| Czechoslovakians | 82.1 /100 | #143 | Excellent 64.6% |
| South American Indians | 81.9 /100 | #144 | Excellent 64.6% |
| Welsh | 80.1 /100 | #145 | Excellent 64.6% |
| Immigrants | Romania | 77.0 /100 | #146 | Good 64.6% |
| Immigrants | Chile | 76.5 /100 | #147 | Good 64.6% |
| Delaware | 76.3 /100 | #148 | Good 64.6% |
| Sioux | 76.3 /100 | #149 | Good 64.6% |
| Romanians | 75.3 /100 | #150 | Good 64.5% |
| Syrians | 75.2 /100 | #151 | Good 64.5% |
| Scottish | 70.9 /100 | #152 | Good 64.5% |
| Swedes | 69.8 /100 | #153 | Good 64.5% |
| Austrians | 68.5 /100 | #154 | Good 64.5% |
| Uruguayans | 67.7 /100 | #155 | Good 64.5% |
| Czechs | 67.0 /100 | #156 | Good 64.5% |