Immigrants from Korea vs Immigrants from Eastern Asia Family Households with Children
COMPARE
Immigrants from Korea
Immigrants from Eastern Asia
Family Households with Children
Family Households with Children Comparison
Immigrants from Korea
Immigrants from Eastern Asia
28.5%
FAMILY HOUSEHOLDS WITH CHILDREN
99.9/ 100
METRIC RATING
69th/ 347
METRIC RANK
27.7%
FAMILY HOUSEHOLDS WITH CHILDREN
81.7/ 100
METRIC RATING
141st/ 347
METRIC RANK
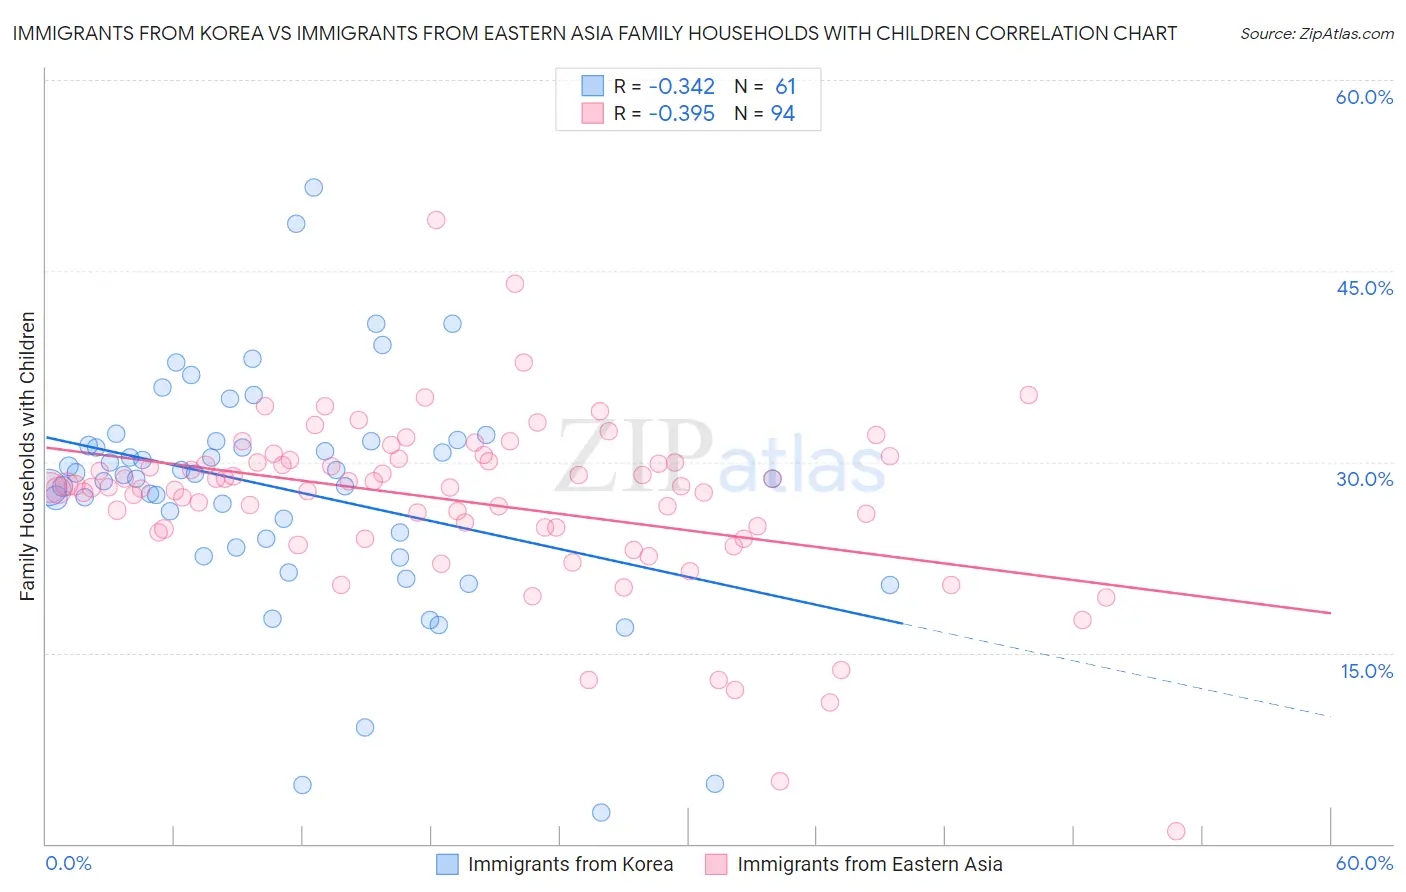
Immigrants from Korea vs Immigrants from Eastern Asia Family Households with Children Correlation Chart
The statistical analysis conducted on geographies consisting of 415,788,077 people shows a mild negative correlation between the proportion of Immigrants from Korea and percentage of family households with children in the United States with a correlation coefficient (R) of -0.342 and weighted average of 28.5%. Similarly, the statistical analysis conducted on geographies consisting of 499,144,786 people shows a mild negative correlation between the proportion of Immigrants from Eastern Asia and percentage of family households with children in the United States with a correlation coefficient (R) of -0.395 and weighted average of 27.7%, a difference of 3.0%.
Family Households with Children Correlation Summary
| Measurement | Immigrants from Korea | Immigrants from Eastern Asia |
| Minimum | 2.4% | 1.0% |
| Maximum | 51.5% | 49.0% |
| Range | 49.1% | 48.0% |
| Mean | 27.8% | 26.9% |
| Median | 29.0% | 28.0% |
| Interquartile 25% (IQ1) | 23.6% | 24.7% |
| Interquartile 75% (IQ3) | 31.6% | 30.1% |
| Interquartile Range (IQR) | 8.0% | 5.4% |
| Standard Deviation (Sample) | 9.0% | 6.9% |
| Standard Deviation (Population) | 9.0% | 6.8% |
Similar Demographics by Family Households with Children
Demographics Similar to Immigrants from Korea by Family Households with Children
In terms of family households with children, the demographic groups most similar to Immigrants from Korea are Houma (28.5%, a difference of 0.020%), Honduran (28.5%, a difference of 0.040%), Immigrants from Egypt (28.5%, a difference of 0.040%), Ghanaian (28.5%, a difference of 0.040%), and Immigrants from Honduras (28.5%, a difference of 0.050%).
| Demographics | Rating | Rank | Family Households with Children |
| Egyptians | 99.9 /100 | #62 | Exceptional 28.6% |
| Immigrants | Lebanon | 99.9 /100 | #63 | Exceptional 28.6% |
| Filipinos | 99.9 /100 | #64 | Exceptional 28.6% |
| Hondurans | 99.9 /100 | #65 | Exceptional 28.5% |
| Immigrants | Egypt | 99.9 /100 | #66 | Exceptional 28.5% |
| Ghanaians | 99.9 /100 | #67 | Exceptional 28.5% |
| Houma | 99.9 /100 | #68 | Exceptional 28.5% |
| Immigrants | Korea | 99.9 /100 | #69 | Exceptional 28.5% |
| Immigrants | Honduras | 99.9 /100 | #70 | Exceptional 28.5% |
| Burmese | 99.9 /100 | #71 | Exceptional 28.5% |
| Immigrants | Indonesia | 99.9 /100 | #72 | Exceptional 28.5% |
| Iraqis | 99.9 /100 | #73 | Exceptional 28.5% |
| Laotians | 99.9 /100 | #74 | Exceptional 28.5% |
| Immigrants | Jordan | 99.9 /100 | #75 | Exceptional 28.4% |
| Immigrants | Sri Lanka | 99.9 /100 | #76 | Exceptional 28.4% |
Demographics Similar to Immigrants from Eastern Asia by Family Households with Children
In terms of family households with children, the demographic groups most similar to Immigrants from Eastern Asia are Spanish (27.7%, a difference of 0.0%), Swiss (27.7%, a difference of 0.010%), Vietnamese (27.7%, a difference of 0.030%), Immigrants from Eastern Africa (27.7%, a difference of 0.050%), and Uruguayan (27.7%, a difference of 0.060%).
| Demographics | Rating | Rank | Family Households with Children |
| Immigrants | Panama | 84.9 /100 | #134 | Excellent 27.7% |
| Immigrants | Ecuador | 84.6 /100 | #135 | Excellent 27.7% |
| Immigrants | Portugal | 84.1 /100 | #136 | Excellent 27.7% |
| Immigrants | Dominican Republic | 83.9 /100 | #137 | Excellent 27.7% |
| Uruguayans | 83.2 /100 | #138 | Excellent 27.7% |
| Vietnamese | 82.6 /100 | #139 | Excellent 27.7% |
| Spanish | 81.8 /100 | #140 | Excellent 27.7% |
| Immigrants | Eastern Asia | 81.7 /100 | #141 | Excellent 27.7% |
| Swiss | 81.4 /100 | #142 | Excellent 27.7% |
| Immigrants | Eastern Africa | 80.2 /100 | #143 | Excellent 27.7% |
| Brazilians | 79.6 /100 | #144 | Good 27.7% |
| Immigrants | Chile | 79.5 /100 | #145 | Good 27.7% |
| Basques | 79.5 /100 | #146 | Good 27.7% |
| Immigrants | Moldova | 79.1 /100 | #147 | Good 27.6% |
| Osage | 79.0 /100 | #148 | Good 27.6% |