Immigrants from Liberia vs Immigrants from Honduras Single Mother Households
COMPARE
Immigrants from Liberia
Immigrants from Honduras
Single Mother Households
Single Mother Households Comparison
Immigrants from Liberia
Immigrants from Honduras
8.7%
SINGLE MOTHER HOUSEHOLDS
0.0/ 100
METRIC RATING
334th/ 347
METRIC RANK
8.2%
SINGLE MOTHER HOUSEHOLDS
0.0/ 100
METRIC RATING
317th/ 347
METRIC RANK
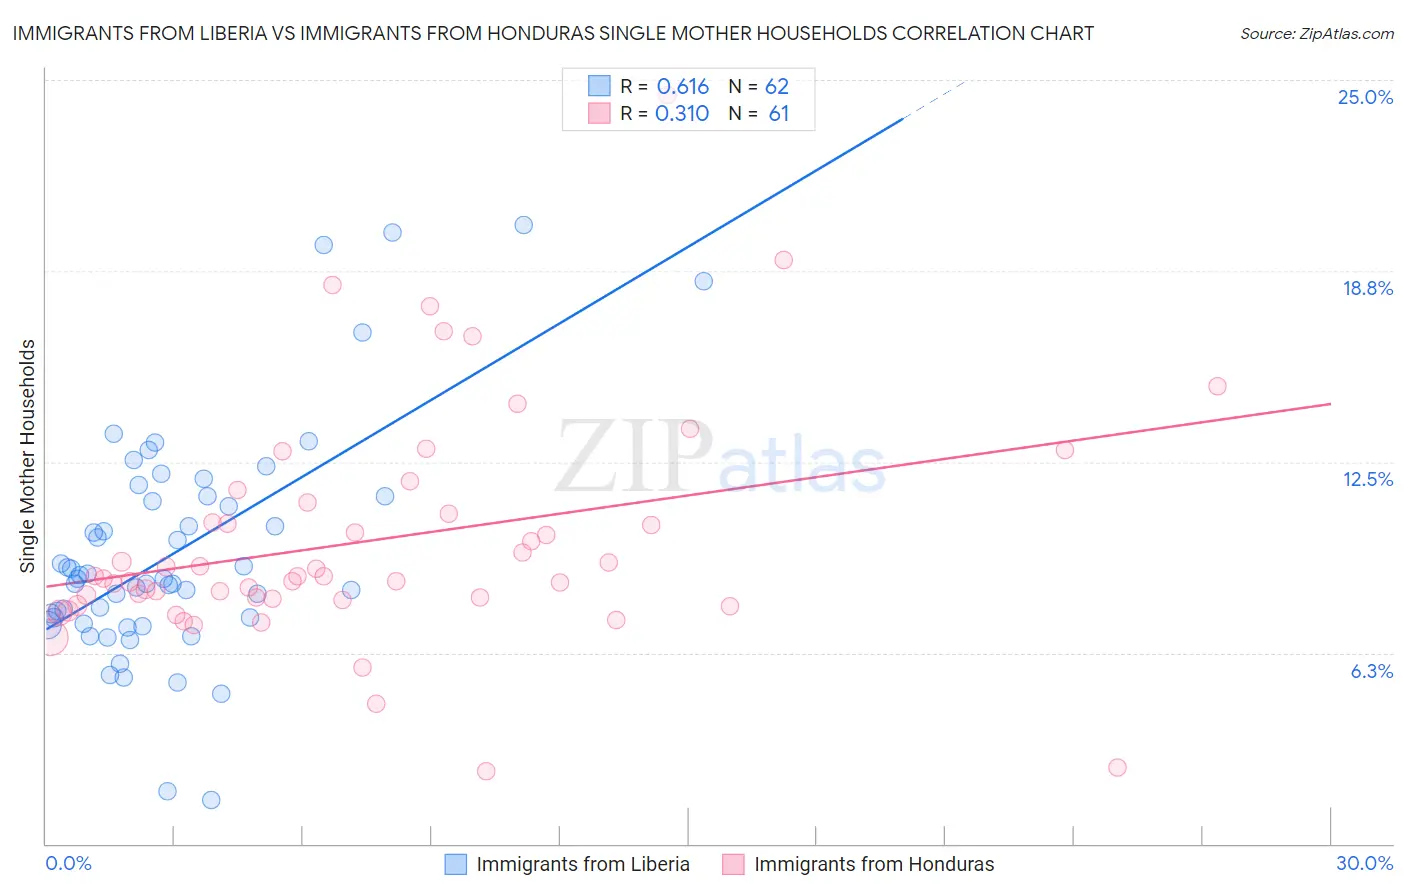
Immigrants from Liberia vs Immigrants from Honduras Single Mother Households Correlation Chart
The statistical analysis conducted on geographies consisting of 135,205,486 people shows a significant positive correlation between the proportion of Immigrants from Liberia and percentage of single mother households in the United States with a correlation coefficient (R) of 0.616 and weighted average of 8.7%. Similarly, the statistical analysis conducted on geographies consisting of 322,086,026 people shows a mild positive correlation between the proportion of Immigrants from Honduras and percentage of single mother households in the United States with a correlation coefficient (R) of 0.310 and weighted average of 8.2%, a difference of 6.4%.
Single Mother Households Correlation Summary
| Measurement | Immigrants from Liberia | Immigrants from Honduras |
| Minimum | 1.4% | 2.4% |
| Maximum | 20.2% | 24.5% |
| Range | 18.8% | 22.1% |
| Mean | 9.6% | 9.9% |
| Median | 8.7% | 8.8% |
| Interquartile 25% (IQ1) | 7.4% | 8.0% |
| Interquartile 75% (IQ3) | 11.4% | 11.0% |
| Interquartile Range (IQR) | 4.0% | 3.0% |
| Standard Deviation (Sample) | 3.8% | 3.8% |
| Standard Deviation (Population) | 3.7% | 3.8% |
Demographics Similar to Immigrants from Liberia and Immigrants from Honduras by Single Mother Households
In terms of single mother households, the demographic groups most similar to Immigrants from Liberia are Immigrants from Dominica (8.7%, a difference of 0.29%), Liberian (8.6%, a difference of 0.80%), U.S. Virgin Islander (8.6%, a difference of 1.1%), Inupiat (8.5%, a difference of 2.7%), and Sioux (8.5%, a difference of 2.7%). Similarly, the demographic groups most similar to Immigrants from Honduras are African (8.2%, a difference of 0.14%), Immigrants from Western Africa (8.2%, a difference of 0.28%), Senegalese (8.2%, a difference of 0.56%), Jamaican (8.2%, a difference of 0.68%), and Bahamian (8.3%, a difference of 0.80%).
| Demographics | Rating | Rank | Single Mother Households |
| Immigrants | Western Africa | 0.0 /100 | #315 | Tragic 8.2% |
| Africans | 0.0 /100 | #316 | Tragic 8.2% |
| Immigrants | Honduras | 0.0 /100 | #317 | Tragic 8.2% |
| Senegalese | 0.0 /100 | #318 | Tragic 8.2% |
| Jamaicans | 0.0 /100 | #319 | Tragic 8.2% |
| Bahamians | 0.0 /100 | #320 | Tragic 8.3% |
| Immigrants | Senegal | 0.0 /100 | #321 | Tragic 8.3% |
| Pima | 0.0 /100 | #322 | Tragic 8.3% |
| Haitians | 0.0 /100 | #323 | Tragic 8.3% |
| Immigrants | Jamaica | 0.0 /100 | #324 | Tragic 8.4% |
| Immigrants | Caribbean | 0.0 /100 | #325 | Tragic 8.4% |
| British West Indians | 0.0 /100 | #326 | Tragic 8.4% |
| Immigrants | Haiti | 0.0 /100 | #327 | Tragic 8.4% |
| Yakama | 0.0 /100 | #328 | Tragic 8.4% |
| Hopi | 0.0 /100 | #329 | Tragic 8.5% |
| Inupiat | 0.0 /100 | #330 | Tragic 8.5% |
| Sioux | 0.0 /100 | #331 | Tragic 8.5% |
| U.S. Virgin Islanders | 0.0 /100 | #332 | Tragic 8.6% |
| Liberians | 0.0 /100 | #333 | Tragic 8.6% |
| Immigrants | Liberia | 0.0 /100 | #334 | Tragic 8.7% |
| Immigrants | Dominica | 0.0 /100 | #335 | Tragic 8.7% |