Immigrants from Iraq vs Immigrants from Netherlands Currently Married
COMPARE
Immigrants from Iraq
Immigrants from Netherlands
Currently Married
Currently Married Comparison
Immigrants from Iraq
Immigrants from Netherlands
47.3%
CURRENTLY MARRIED
82.8/ 100
METRIC RATING
130th/ 347
METRIC RANK
48.5%
CURRENTLY MARRIED
98.6/ 100
METRIC RATING
57th/ 347
METRIC RANK
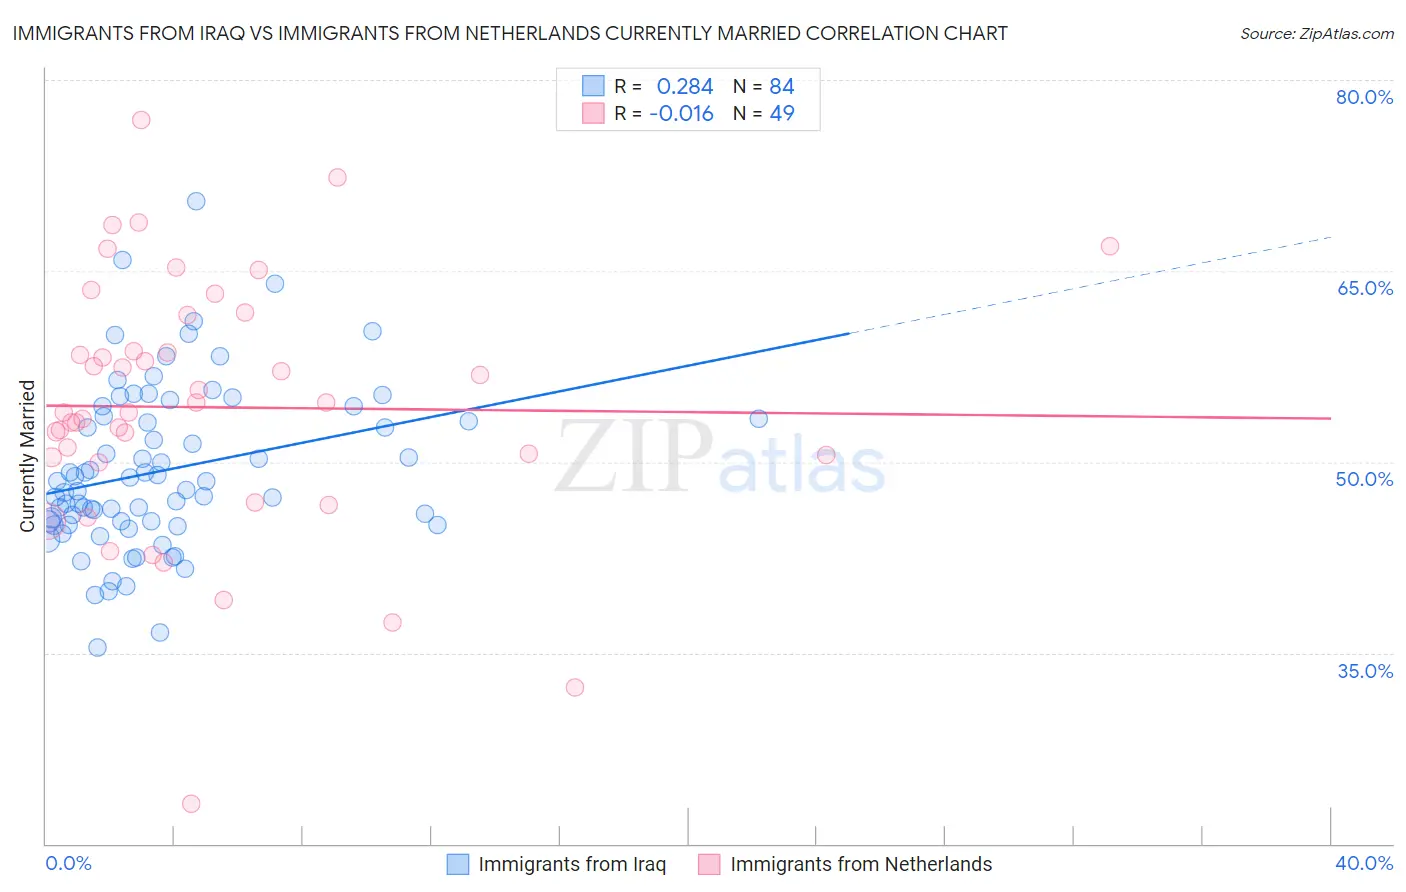
Immigrants from Iraq vs Immigrants from Netherlands Currently Married Correlation Chart
The statistical analysis conducted on geographies consisting of 194,780,853 people shows a weak positive correlation between the proportion of Immigrants from Iraq and percentage of population currently married in the United States with a correlation coefficient (R) of 0.284 and weighted average of 47.3%. Similarly, the statistical analysis conducted on geographies consisting of 237,864,062 people shows no correlation between the proportion of Immigrants from Netherlands and percentage of population currently married in the United States with a correlation coefficient (R) of -0.016 and weighted average of 48.5%, a difference of 2.4%.
Currently Married Correlation Summary
| Measurement | Immigrants from Iraq | Immigrants from Netherlands |
| Minimum | 35.4% | 23.1% |
| Maximum | 70.5% | 76.9% |
| Range | 35.1% | 53.8% |
| Mean | 49.3% | 54.3% |
| Median | 48.1% | 53.9% |
| Interquartile 25% (IQ1) | 45.2% | 50.2% |
| Interquartile 75% (IQ3) | 53.5% | 60.2% |
| Interquartile Range (IQR) | 8.3% | 10.0% |
| Standard Deviation (Sample) | 6.5% | 10.1% |
| Standard Deviation (Population) | 6.4% | 10.0% |
Similar Demographics by Currently Married
Demographics Similar to Immigrants from Iraq by Currently Married
In terms of currently married, the demographic groups most similar to Immigrants from Iraq are Icelander (47.3%, a difference of 0.020%), Sri Lankan (47.3%, a difference of 0.030%), Afghan (47.3%, a difference of 0.060%), Portuguese (47.3%, a difference of 0.090%), and Immigrants from Malaysia (47.3%, a difference of 0.10%).
| Demographics | Rating | Rank | Currently Married |
| Immigrants | Kazakhstan | 87.2 /100 | #123 | Excellent 47.4% |
| Laotians | 86.6 /100 | #124 | Excellent 47.4% |
| Okinawans | 85.3 /100 | #125 | Excellent 47.4% |
| Immigrants | Jordan | 84.9 /100 | #126 | Excellent 47.4% |
| New Zealanders | 84.9 /100 | #127 | Excellent 47.4% |
| Portuguese | 84.2 /100 | #128 | Excellent 47.3% |
| Sri Lankans | 83.2 /100 | #129 | Excellent 47.3% |
| Immigrants | Iraq | 82.8 /100 | #130 | Excellent 47.3% |
| Icelanders | 82.4 /100 | #131 | Excellent 47.3% |
| Afghans | 81.8 /100 | #132 | Excellent 47.3% |
| Immigrants | Malaysia | 81.1 /100 | #133 | Excellent 47.3% |
| Immigrants | Australia | 81.1 /100 | #134 | Excellent 47.3% |
| Immigrants | Norway | 79.7 /100 | #135 | Good 47.2% |
| Immigrants | Vietnam | 78.2 /100 | #136 | Good 47.2% |
| Paraguayans | 77.8 /100 | #137 | Good 47.2% |
Demographics Similar to Immigrants from Netherlands by Currently Married
In terms of currently married, the demographic groups most similar to Immigrants from Netherlands are Immigrants from Moldova (48.5%, a difference of 0.030%), Immigrants from North Macedonia (48.5%, a difference of 0.030%), Latvian (48.5%, a difference of 0.030%), French (48.4%, a difference of 0.040%), and Immigrants from Ireland (48.4%, a difference of 0.070%).
| Demographics | Rating | Rank | Currently Married |
| Iranians | 99.0 /100 | #50 | Exceptional 48.6% |
| Whites/Caucasians | 99.0 /100 | #51 | Exceptional 48.6% |
| Russians | 98.9 /100 | #52 | Exceptional 48.6% |
| Immigrants | Austria | 98.8 /100 | #53 | Exceptional 48.5% |
| Immigrants | Moldova | 98.7 /100 | #54 | Exceptional 48.5% |
| Immigrants | North Macedonia | 98.7 /100 | #55 | Exceptional 48.5% |
| Latvians | 98.7 /100 | #56 | Exceptional 48.5% |
| Immigrants | Netherlands | 98.6 /100 | #57 | Exceptional 48.5% |
| French | 98.6 /100 | #58 | Exceptional 48.4% |
| Immigrants | Ireland | 98.5 /100 | #59 | Exceptional 48.4% |
| Immigrants | Romania | 98.5 /100 | #60 | Exceptional 48.4% |
| Romanians | 98.5 /100 | #61 | Exceptional 48.4% |
| Asians | 98.5 /100 | #62 | Exceptional 48.4% |
| Slavs | 98.3 /100 | #63 | Exceptional 48.4% |
| Immigrants | Czechoslovakia | 98.3 /100 | #64 | Exceptional 48.4% |