Immigrants from Iran vs Immigrants from Belgium Single Father Households
COMPARE
Immigrants from Iran
Immigrants from Belgium
Single Father Households
Single Father Households Comparison
Immigrants from Iran
Immigrants from Belgium
1.9%
SINGLE FATHER HOUSEHOLDS
100.0/ 100
METRIC RATING
16th/ 347
METRIC RANK
2.0%
SINGLE FATHER HOUSEHOLDS
100.0/ 100
METRIC RATING
36th/ 347
METRIC RANK
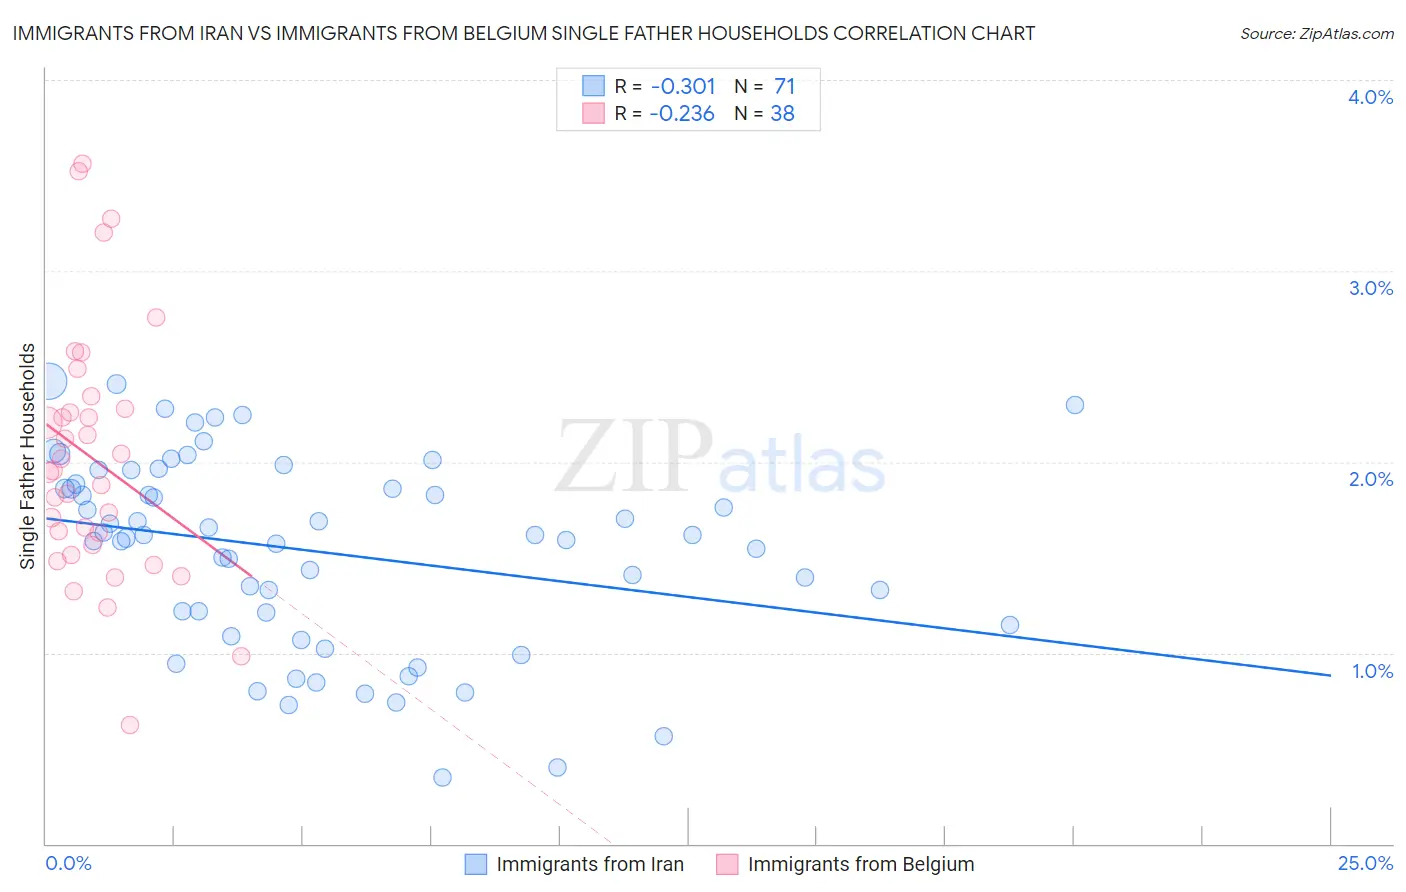
Immigrants from Iran vs Immigrants from Belgium Single Father Households Correlation Chart
The statistical analysis conducted on geographies consisting of 278,578,987 people shows a mild negative correlation between the proportion of Immigrants from Iran and percentage of single father households in the United States with a correlation coefficient (R) of -0.301 and weighted average of 1.9%. Similarly, the statistical analysis conducted on geographies consisting of 146,023,758 people shows a weak negative correlation between the proportion of Immigrants from Belgium and percentage of single father households in the United States with a correlation coefficient (R) of -0.236 and weighted average of 2.0%, a difference of 4.9%.
Single Father Households Correlation Summary
| Measurement | Immigrants from Iran | Immigrants from Belgium |
| Minimum | 0.34% | 0.62% |
| Maximum | 2.4% | 3.6% |
| Range | 2.1% | 2.9% |
| Mean | 1.5% | 2.0% |
| Median | 1.6% | 2.0% |
| Interquartile 25% (IQ1) | 1.1% | 1.6% |
| Interquartile 75% (IQ3) | 1.9% | 2.3% |
| Interquartile Range (IQR) | 0.74% | 0.71% |
| Standard Deviation (Sample) | 0.50% | 0.66% |
| Standard Deviation (Population) | 0.50% | 0.65% |
Demographics Similar to Immigrants from Iran and Immigrants from Belgium by Single Father Households
In terms of single father households, the demographic groups most similar to Immigrants from Iran are Immigrants from India (1.9%, a difference of 0.23%), Indian (Asian) (1.9%, a difference of 0.72%), Iranian (1.9%, a difference of 1.6%), Thai (1.9%, a difference of 1.6%), and Immigrants from Albania (1.9%, a difference of 1.9%). Similarly, the demographic groups most similar to Immigrants from Belgium are Albanian (2.0%, a difference of 0.11%), Immigrants from Australia (2.0%, a difference of 0.43%), Turkish (2.0%, a difference of 0.45%), Chinese (2.0%, a difference of 0.66%), and Israeli (2.0%, a difference of 0.71%).
| Demographics | Rating | Rank | Single Father Households |
| Immigrants | Iran | 100.0 /100 | #16 | Exceptional 1.9% |
| Immigrants | India | 100.0 /100 | #17 | Exceptional 1.9% |
| Indians (Asian) | 100.0 /100 | #18 | Exceptional 1.9% |
| Iranians | 100.0 /100 | #19 | Exceptional 1.9% |
| Thais | 100.0 /100 | #20 | Exceptional 1.9% |
| Immigrants | Albania | 100.0 /100 | #21 | Exceptional 1.9% |
| Immigrants | Latvia | 100.0 /100 | #22 | Exceptional 1.9% |
| Immigrants | Croatia | 100.0 /100 | #23 | Exceptional 2.0% |
| Immigrants | Russia | 100.0 /100 | #24 | Exceptional 2.0% |
| Eastern Europeans | 100.0 /100 | #25 | Exceptional 2.0% |
| Assyrians/Chaldeans/Syriacs | 100.0 /100 | #26 | Exceptional 2.0% |
| Immigrants | South Central Asia | 100.0 /100 | #27 | Exceptional 2.0% |
| Immigrants | Japan | 100.0 /100 | #28 | Exceptional 2.0% |
| Bulgarians | 100.0 /100 | #29 | Exceptional 2.0% |
| Cambodians | 100.0 /100 | #30 | Exceptional 2.0% |
| Israelis | 100.0 /100 | #31 | Exceptional 2.0% |
| Chinese | 100.0 /100 | #32 | Exceptional 2.0% |
| Turks | 100.0 /100 | #33 | Exceptional 2.0% |
| Immigrants | Australia | 100.0 /100 | #34 | Exceptional 2.0% |
| Albanians | 100.0 /100 | #35 | Exceptional 2.0% |
| Immigrants | Belgium | 100.0 /100 | #36 | Exceptional 2.0% |