Hmong vs Colville Single Father Households
COMPARE
Hmong
Colville
Single Father Households
Single Father Households Comparison
Hmong
Colville
2.4%
SINGLE FATHER HOUSEHOLDS
33.0/ 100
METRIC RATING
188th/ 347
METRIC RANK
3.3%
SINGLE FATHER HOUSEHOLDS
0.0/ 100
METRIC RATING
335th/ 347
METRIC RANK
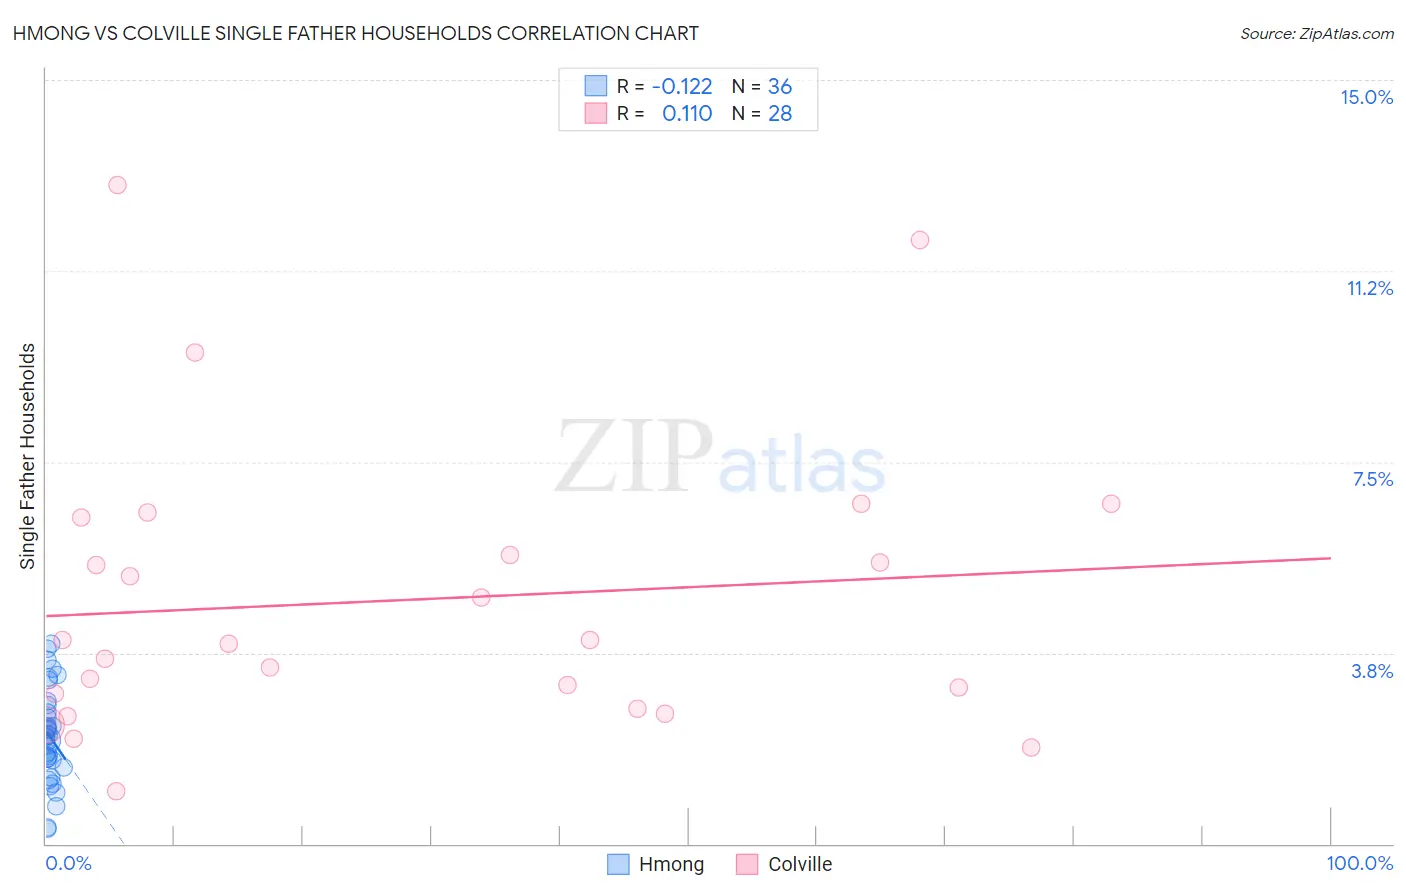
Hmong vs Colville Single Father Households Correlation Chart
The statistical analysis conducted on geographies consisting of 24,655,242 people shows a poor negative correlation between the proportion of Hmong and percentage of single father households in the United States with a correlation coefficient (R) of -0.122 and weighted average of 2.4%. Similarly, the statistical analysis conducted on geographies consisting of 34,617,249 people shows a poor positive correlation between the proportion of Colville and percentage of single father households in the United States with a correlation coefficient (R) of 0.110 and weighted average of 3.3%, a difference of 39.2%.
Single Father Households Correlation Summary
| Measurement | Hmong | Colville |
| Minimum | 0.30% | 1.0% |
| Maximum | 3.9% | 12.9% |
| Range | 3.6% | 11.9% |
| Mean | 2.1% | 4.8% |
| Median | 2.1% | 4.0% |
| Interquartile 25% (IQ1) | 1.6% | 2.8% |
| Interquartile 75% (IQ3) | 2.7% | 6.0% |
| Interquartile Range (IQR) | 1.1% | 3.2% |
| Standard Deviation (Sample) | 0.92% | 2.9% |
| Standard Deviation (Population) | 0.91% | 2.8% |
Similar Demographics by Single Father Households
Demographics Similar to Hmong by Single Father Households
In terms of single father households, the demographic groups most similar to Hmong are Immigrants from Colombia (2.4%, a difference of 0.080%), U.S. Virgin Islander (2.4%, a difference of 0.10%), French (2.4%, a difference of 0.11%), Immigrants from Africa (2.4%, a difference of 0.25%), and Immigrants from Sudan (2.4%, a difference of 0.27%).
| Demographics | Rating | Rank | Single Father Households |
| Jamaicans | 43.5 /100 | #181 | Average 2.3% |
| Belgians | 43.3 /100 | #182 | Average 2.3% |
| Immigrants | Panama | 41.8 /100 | #183 | Average 2.4% |
| Sri Lankans | 41.8 /100 | #184 | Average 2.4% |
| Nigerians | 41.0 /100 | #185 | Average 2.4% |
| Immigrants | Bosnia and Herzegovina | 40.4 /100 | #186 | Average 2.4% |
| Immigrants | Colombia | 34.0 /100 | #187 | Fair 2.4% |
| Hmong | 33.0 /100 | #188 | Fair 2.4% |
| U.S. Virgin Islanders | 31.8 /100 | #189 | Fair 2.4% |
| French | 31.7 /100 | #190 | Fair 2.4% |
| Immigrants | Africa | 30.0 /100 | #191 | Fair 2.4% |
| Immigrants | Sudan | 29.8 /100 | #192 | Fair 2.4% |
| Uruguayans | 29.7 /100 | #193 | Fair 2.4% |
| Panamanians | 29.6 /100 | #194 | Fair 2.4% |
| Immigrants | Philippines | 28.7 /100 | #195 | Fair 2.4% |
Demographics Similar to Colville by Single Father Households
In terms of single father households, the demographic groups most similar to Colville are Yuman (3.3%, a difference of 0.020%), Paiute (3.3%, a difference of 0.030%), Pueblo (3.3%, a difference of 0.28%), Sioux (3.3%, a difference of 0.96%), and Alaskan Athabascan (3.4%, a difference of 2.4%).
| Demographics | Rating | Rank | Single Father Households |
| Immigrants | Cabo Verde | 0.0 /100 | #328 | Tragic 3.1% |
| Chippewa | 0.0 /100 | #329 | Tragic 3.1% |
| Nepalese | 0.0 /100 | #330 | Tragic 3.1% |
| Navajo | 0.0 /100 | #331 | Tragic 3.2% |
| Yaqui | 0.0 /100 | #332 | Tragic 3.2% |
| Natives/Alaskans | 0.0 /100 | #333 | Tragic 3.2% |
| Yuman | 0.0 /100 | #334 | Tragic 3.3% |
| Colville | 0.0 /100 | #335 | Tragic 3.3% |
| Paiute | 0.0 /100 | #336 | Tragic 3.3% |
| Pueblo | 0.0 /100 | #337 | Tragic 3.3% |
| Sioux | 0.0 /100 | #338 | Tragic 3.3% |
| Alaskan Athabascans | 0.0 /100 | #339 | Tragic 3.4% |
| Alaska Natives | 0.0 /100 | #340 | Tragic 3.5% |
| Crow | 0.0 /100 | #341 | Tragic 3.5% |
| Tohono O'odham | 0.0 /100 | #342 | Tragic 3.8% |