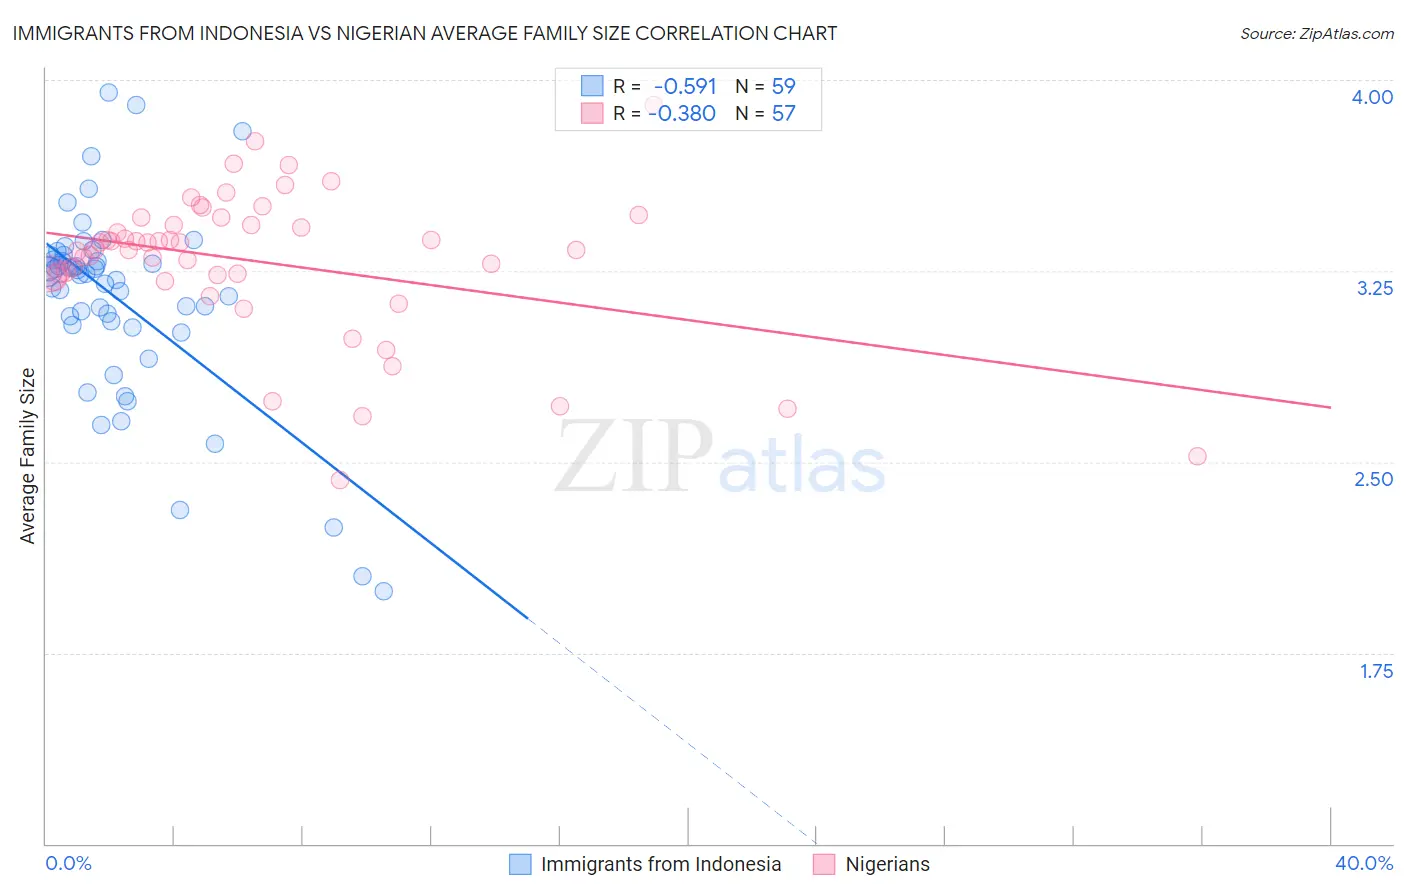
Immigrants from Indonesia vs Nigerian Average Family Size
COMPARE
Immigrants from Indonesia
Nigerian
Average Family Size
Average Family Size Comparison
Immigrants from Indonesia
Nigerians
3.27
AVERAGE FAMILY SIZE
93.7/ 100
METRIC RATING
119th/ 347
METRIC RANK
3.29
AVERAGE FAMILY SIZE
98.6/ 100
METRIC RATING
99th/ 347
METRIC RANK
Immigrants from Indonesia vs Nigerian Average Family Size Correlation Chart
The statistical analysis conducted on geographies consisting of 215,720,751 people shows a substantial negative correlation between the proportion of Immigrants from Indonesia and average family size in the United States with a correlation coefficient (R) of -0.591 and weighted average of 3.27. Similarly, the statistical analysis conducted on geographies consisting of 332,464,526 people shows a mild negative correlation between the proportion of Nigerians and average family size in the United States with a correlation coefficient (R) of -0.380 and weighted average of 3.29, a difference of 0.71%.
Average Family Size Correlation Summary
| Measurement | Immigrants from Indonesia | Nigerian |
| Minimum | 1.99 | 2.43 |
| Maximum | 3.95 | 3.90 |
| Range | 1.96 | 1.47 |
| Mean | 3.14 | 3.28 |
| Median | 3.24 | 3.34 |
| Interquartile 25% (IQ1) | 3.04 | 3.23 |
| Interquartile 75% (IQ3) | 3.31 | 3.45 |
| Interquartile Range (IQR) | 0.27 | 0.22 |
| Standard Deviation (Sample) | 0.38 | 0.29 |
| Standard Deviation (Population) | 0.38 | 0.29 |
Demographics Similar to Immigrants from Indonesia and Nigerians by Average Family Size
In terms of average family size, the demographic groups most similar to Immigrants from Indonesia are Immigrants from Asia (3.27, a difference of 0.020%), Kiowa (3.27, a difference of 0.090%), Immigrants from South America (3.27, a difference of 0.10%), Immigrants from Liberia (3.27, a difference of 0.11%), and South American (3.27, a difference of 0.12%). Similarly, the demographic groups most similar to Nigerians are Guamanian/Chamorro (3.29, a difference of 0.010%), Immigrants from Burma/Myanmar (3.29, a difference of 0.020%), West Indian (3.29, a difference of 0.030%), Immigrants from Western Africa (3.29, a difference of 0.060%), and Bolivian (3.29, a difference of 0.10%).
| Demographics | Rating | Rank | Average Family Size |
| Nigerians | 98.6 /100 | #99 | Exceptional 3.29 |
| Guamanians/Chamorros | 98.6 /100 | #100 | Exceptional 3.29 |
| Immigrants | Burma/Myanmar | 98.6 /100 | #101 | Exceptional 3.29 |
| West Indians | 98.5 /100 | #102 | Exceptional 3.29 |
| Immigrants | Western Africa | 98.4 /100 | #103 | Exceptional 3.29 |
| Bolivians | 98.3 /100 | #104 | Exceptional 3.29 |
| Immigrants | Ghana | 98.1 /100 | #105 | Exceptional 3.29 |
| Paiute | 98.0 /100 | #106 | Exceptional 3.29 |
| Ghanaians | 98.0 /100 | #107 | Exceptional 3.29 |
| Asians | 97.0 /100 | #108 | Exceptional 3.28 |
| Puerto Ricans | 96.7 /100 | #109 | Exceptional 3.28 |
| Bahamians | 96.6 /100 | #110 | Exceptional 3.28 |
| Indonesians | 96.2 /100 | #111 | Exceptional 3.28 |
| Blacks/African Americans | 95.7 /100 | #112 | Exceptional 3.27 |
| Immigrants | Panama | 95.6 /100 | #113 | Exceptional 3.27 |
| South Americans | 95.1 /100 | #114 | Exceptional 3.27 |
| Immigrants | Liberia | 95.0 /100 | #115 | Exceptional 3.27 |
| Immigrants | South America | 95.0 /100 | #116 | Exceptional 3.27 |
| Kiowa | 94.8 /100 | #117 | Exceptional 3.27 |
| Immigrants | Asia | 94.0 /100 | #118 | Exceptional 3.27 |
| Immigrants | Indonesia | 93.7 /100 | #119 | Exceptional 3.27 |