Immigrants from Indonesia vs Immigrants from Eritrea Average Family Size
COMPARE
Immigrants from Indonesia
Immigrants from Eritrea
Average Family Size
Average Family Size Comparison
Immigrants from Indonesia
Immigrants from Eritrea
3.27
AVERAGE FAMILY SIZE
93.7/ 100
METRIC RATING
119th/ 347
METRIC RANK
3.24
AVERAGE FAMILY SIZE
71.4/ 100
METRIC RATING
153rd/ 347
METRIC RANK
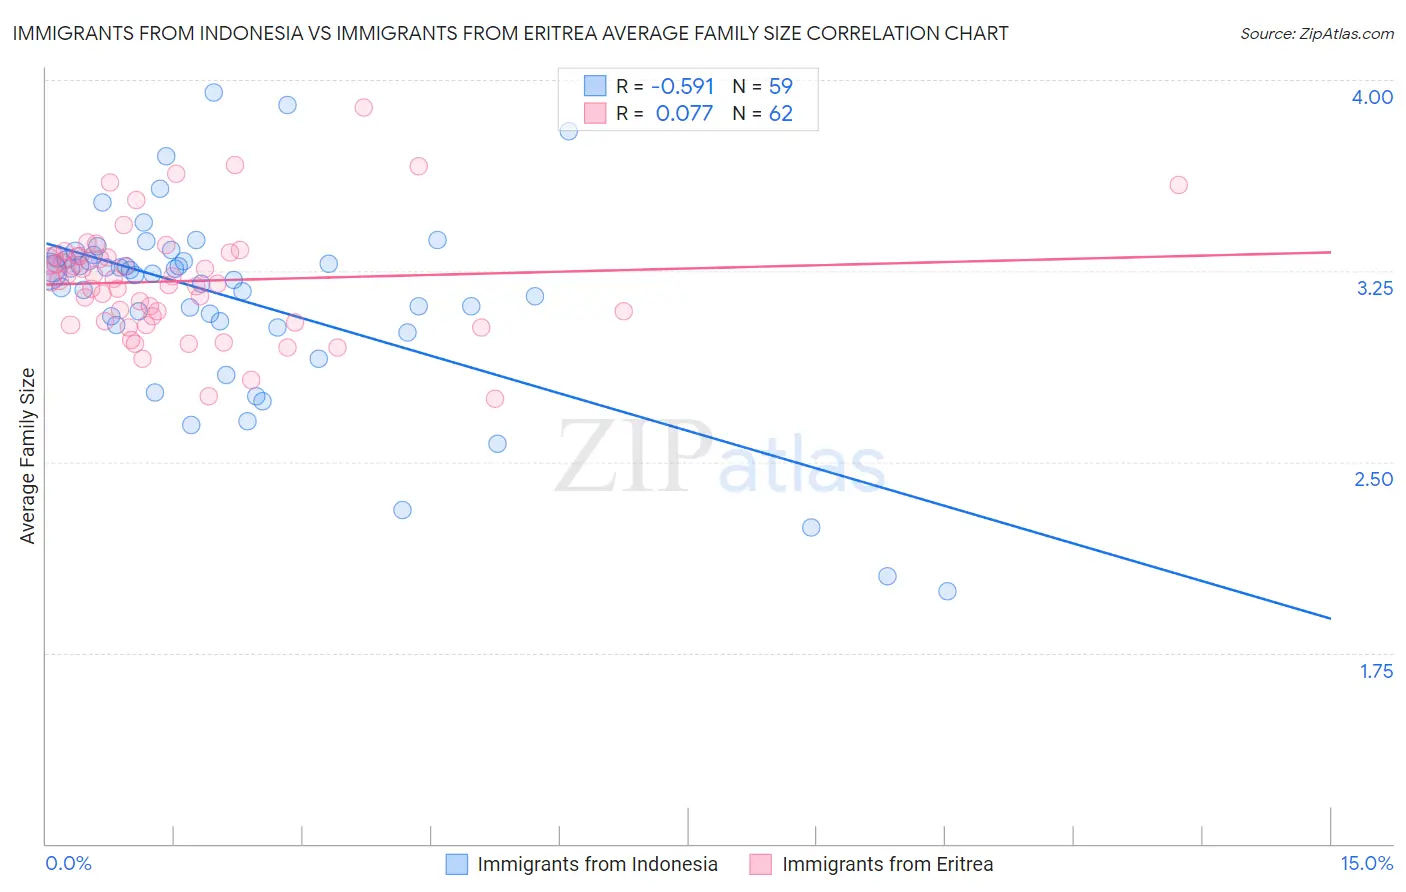
Immigrants from Indonesia vs Immigrants from Eritrea Average Family Size Correlation Chart
The statistical analysis conducted on geographies consisting of 215,720,751 people shows a substantial negative correlation between the proportion of Immigrants from Indonesia and average family size in the United States with a correlation coefficient (R) of -0.591 and weighted average of 3.27. Similarly, the statistical analysis conducted on geographies consisting of 104,794,375 people shows a slight positive correlation between the proportion of Immigrants from Eritrea and average family size in the United States with a correlation coefficient (R) of 0.077 and weighted average of 3.24, a difference of 0.81%.
Average Family Size Correlation Summary
| Measurement | Immigrants from Indonesia | Immigrants from Eritrea |
| Minimum | 1.99 | 2.75 |
| Maximum | 3.95 | 3.89 |
| Range | 1.96 | 1.14 |
| Mean | 3.14 | 3.21 |
| Median | 3.24 | 3.21 |
| Interquartile 25% (IQ1) | 3.04 | 3.05 |
| Interquartile 75% (IQ3) | 3.31 | 3.31 |
| Interquartile Range (IQR) | 0.27 | 0.25 |
| Standard Deviation (Sample) | 0.38 | 0.22 |
| Standard Deviation (Population) | 0.38 | 0.22 |
Similar Demographics by Average Family Size
Demographics Similar to Immigrants from Indonesia by Average Family Size
In terms of average family size, the demographic groups most similar to Immigrants from Indonesia are Immigrants from Bahamas (3.27, a difference of 0.010%), Immigrants from Asia (3.27, a difference of 0.020%), Immigrants from Thailand (3.27, a difference of 0.040%), Immigrants from Colombia (3.27, a difference of 0.070%), and Kiowa (3.27, a difference of 0.090%).
| Demographics | Rating | Rank | Average Family Size |
| Blacks/African Americans | 95.7 /100 | #112 | Exceptional 3.27 |
| Immigrants | Panama | 95.6 /100 | #113 | Exceptional 3.27 |
| South Americans | 95.1 /100 | #114 | Exceptional 3.27 |
| Immigrants | Liberia | 95.0 /100 | #115 | Exceptional 3.27 |
| Immigrants | South America | 95.0 /100 | #116 | Exceptional 3.27 |
| Kiowa | 94.8 /100 | #117 | Exceptional 3.27 |
| Immigrants | Asia | 94.0 /100 | #118 | Exceptional 3.27 |
| Immigrants | Indonesia | 93.7 /100 | #119 | Exceptional 3.27 |
| Immigrants | Bahamas | 93.6 /100 | #120 | Exceptional 3.27 |
| Immigrants | Thailand | 93.3 /100 | #121 | Exceptional 3.27 |
| Immigrants | Colombia | 92.8 /100 | #122 | Exceptional 3.27 |
| Alaskan Athabascans | 92.4 /100 | #123 | Exceptional 3.27 |
| South American Indians | 91.6 /100 | #124 | Exceptional 3.26 |
| Immigrants | Cuba | 91.3 /100 | #125 | Exceptional 3.26 |
| Immigrants | Costa Rica | 90.7 /100 | #126 | Exceptional 3.26 |
Demographics Similar to Immigrants from Eritrea by Average Family Size
In terms of average family size, the demographic groups most similar to Immigrants from Eritrea are Spanish American (3.24, a difference of 0.020%), Immigrants from Egypt (3.24, a difference of 0.030%), Assyrian/Chaldean/Syriac (3.24, a difference of 0.050%), Indian (Asian) (3.24, a difference of 0.050%), and Jordanian (3.24, a difference of 0.050%).
| Demographics | Rating | Rank | Average Family Size |
| Immigrants | Africa | 77.9 /100 | #146 | Good 3.25 |
| Immigrants | Jordan | 75.7 /100 | #147 | Good 3.24 |
| Blackfeet | 75.0 /100 | #148 | Good 3.24 |
| Assyrians/Chaldeans/Syriacs | 73.8 /100 | #149 | Good 3.24 |
| Indians (Asian) | 73.6 /100 | #150 | Good 3.24 |
| Jordanians | 73.5 /100 | #151 | Good 3.24 |
| Spanish Americans | 72.5 /100 | #152 | Good 3.24 |
| Immigrants | Eritrea | 71.4 /100 | #153 | Good 3.24 |
| Immigrants | Egypt | 70.0 /100 | #154 | Good 3.24 |
| Seminole | 68.2 /100 | #155 | Good 3.24 |
| Immigrants | Taiwan | 68.1 /100 | #156 | Good 3.24 |
| Immigrants | Uzbekistan | 67.0 /100 | #157 | Good 3.24 |
| Iraqis | 64.3 /100 | #158 | Good 3.24 |
| Ethiopians | 63.9 /100 | #159 | Good 3.24 |
| Immigrants | Iraq | 63.7 /100 | #160 | Good 3.24 |