Immigrants from Hungary vs Immigrants from North America 5th Grade
COMPARE
Immigrants from Hungary
Immigrants from North America
5th Grade
5th Grade Comparison
Immigrants from Hungary
Immigrants from North America
97.6%
5TH GRADE
90.1/ 100
METRIC RATING
134th/ 347
METRIC RANK
97.9%
5TH GRADE
99.7/ 100
METRIC RATING
62nd/ 347
METRIC RANK
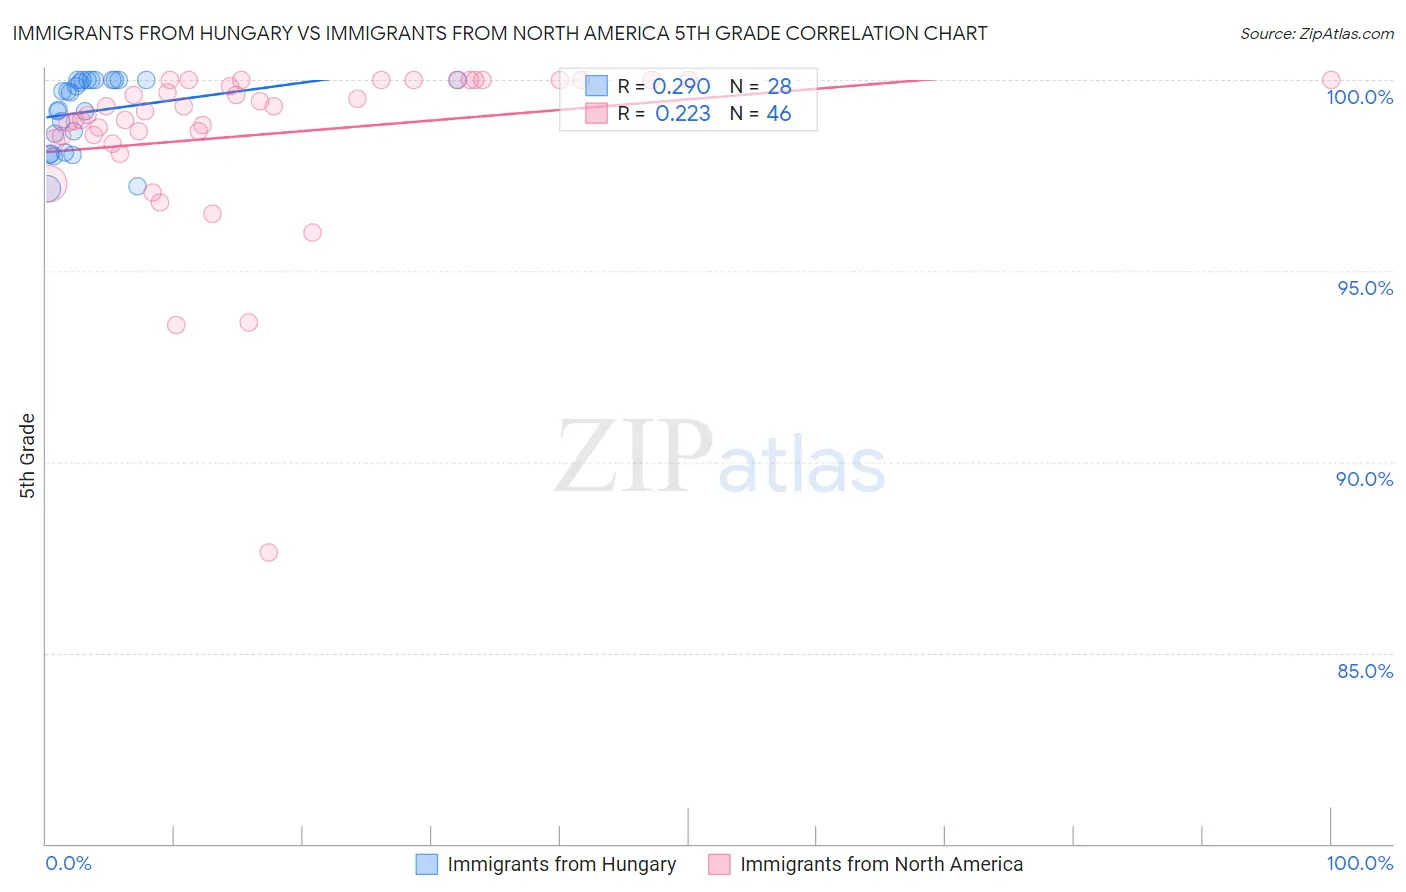
Immigrants from Hungary vs Immigrants from North America 5th Grade Correlation Chart
The statistical analysis conducted on geographies consisting of 195,707,305 people shows a weak positive correlation between the proportion of Immigrants from Hungary and percentage of population with at least 5th grade education in the United States with a correlation coefficient (R) of 0.290 and weighted average of 97.6%. Similarly, the statistical analysis conducted on geographies consisting of 462,462,330 people shows a weak positive correlation between the proportion of Immigrants from North America and percentage of population with at least 5th grade education in the United States with a correlation coefficient (R) of 0.223 and weighted average of 97.9%, a difference of 0.37%.
5th Grade Correlation Summary
| Measurement | Immigrants from Hungary | Immigrants from North America |
| Minimum | 97.1% | 87.6% |
| Maximum | 100.0% | 100.0% |
| Range | 2.9% | 12.4% |
| Mean | 99.2% | 98.6% |
| Median | 99.7% | 99.2% |
| Interquartile 25% (IQ1) | 98.4% | 98.5% |
| Interquartile 75% (IQ3) | 100.0% | 100.0% |
| Interquartile Range (IQR) | 1.6% | 1.5% |
| Standard Deviation (Sample) | 0.93% | 2.2% |
| Standard Deviation (Population) | 0.92% | 2.2% |
Similar Demographics by 5th Grade
Demographics Similar to Immigrants from Hungary by 5th Grade
In terms of 5th grade, the demographic groups most similar to Immigrants from Hungary are Immigrants from Kuwait (97.6%, a difference of 0.0%), Cambodian (97.6%, a difference of 0.0%), Pima (97.6%, a difference of 0.010%), Palestinian (97.5%, a difference of 0.010%), and Colville (97.6%, a difference of 0.020%).
| Demographics | Rating | Rank | 5th Grade |
| Immigrants | Serbia | 92.3 /100 | #127 | Exceptional 97.6% |
| Colville | 92.0 /100 | #128 | Exceptional 97.6% |
| Immigrants | Europe | 91.9 /100 | #129 | Exceptional 97.6% |
| Immigrants | Romania | 91.6 /100 | #130 | Exceptional 97.6% |
| Pima | 91.2 /100 | #131 | Exceptional 97.6% |
| Immigrants | Kuwait | 90.4 /100 | #132 | Exceptional 97.6% |
| Cambodians | 90.2 /100 | #133 | Exceptional 97.6% |
| Immigrants | Hungary | 90.1 /100 | #134 | Exceptional 97.6% |
| Palestinians | 89.3 /100 | #135 | Excellent 97.5% |
| Immigrants | Moldova | 87.5 /100 | #136 | Excellent 97.5% |
| Filipinos | 86.8 /100 | #137 | Excellent 97.5% |
| Blackfeet | 86.8 /100 | #138 | Excellent 97.5% |
| Immigrants | Turkey | 86.7 /100 | #139 | Excellent 97.5% |
| Burmese | 86.1 /100 | #140 | Excellent 97.5% |
| Seminole | 85.8 /100 | #141 | Excellent 97.5% |
Demographics Similar to Immigrants from North America by 5th Grade
In terms of 5th grade, the demographic groups most similar to Immigrants from North America are Serbian (97.9%, a difference of 0.0%), Immigrants from Canada (97.9%, a difference of 0.010%), Russian (97.9%, a difference of 0.010%), American (97.9%, a difference of 0.020%), and Immigrants from Northern Europe (97.9%, a difference of 0.020%).
| Demographics | Rating | Rank | 5th Grade |
| Creek | 99.8 /100 | #55 | Exceptional 98.0% |
| Greeks | 99.8 /100 | #56 | Exceptional 97.9% |
| Austrians | 99.8 /100 | #57 | Exceptional 97.9% |
| Whites/Caucasians | 99.8 /100 | #58 | Exceptional 97.9% |
| Americans | 99.7 /100 | #59 | Exceptional 97.9% |
| Immigrants | Canada | 99.7 /100 | #60 | Exceptional 97.9% |
| Serbians | 99.7 /100 | #61 | Exceptional 97.9% |
| Immigrants | North America | 99.7 /100 | #62 | Exceptional 97.9% |
| Russians | 99.7 /100 | #63 | Exceptional 97.9% |
| Immigrants | Northern Europe | 99.6 /100 | #64 | Exceptional 97.9% |
| Canadians | 99.6 /100 | #65 | Exceptional 97.9% |
| Immigrants | Austria | 99.6 /100 | #66 | Exceptional 97.9% |
| New Zealanders | 99.6 /100 | #67 | Exceptional 97.9% |
| Cajuns | 99.6 /100 | #68 | Exceptional 97.9% |
| Kiowa | 99.5 /100 | #69 | Exceptional 97.9% |