Immigrants from Morocco vs British Births to Unmarried Women
COMPARE
Immigrants from Morocco
British
Births to Unmarried Women
Births to Unmarried Women Comparison
Immigrants from Morocco
British
30.4%
BIRTHS TO UNMARRIED WOMEN
85.2/ 100
METRIC RATING
133rd/ 347
METRIC RANK
30.8%
BIRTHS TO UNMARRIED WOMEN
76.0/ 100
METRIC RATING
153rd/ 347
METRIC RANK
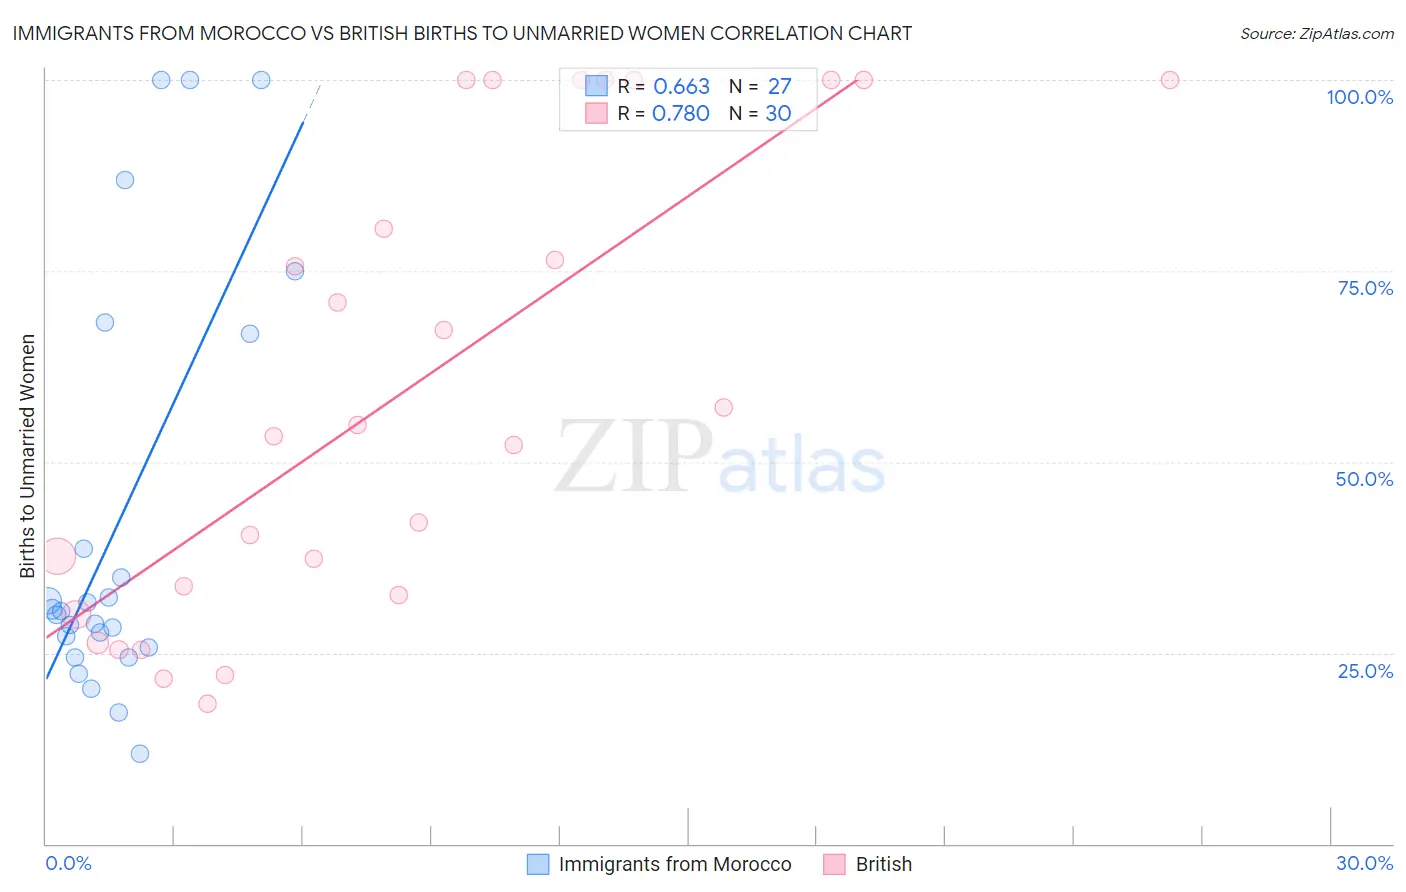
Immigrants from Morocco vs British Births to Unmarried Women Correlation Chart
The statistical analysis conducted on geographies consisting of 172,654,004 people shows a significant positive correlation between the proportion of Immigrants from Morocco and percentage of births to unmarried women in the United States with a correlation coefficient (R) of 0.663 and weighted average of 30.4%. Similarly, the statistical analysis conducted on geographies consisting of 478,658,023 people shows a strong positive correlation between the proportion of British and percentage of births to unmarried women in the United States with a correlation coefficient (R) of 0.780 and weighted average of 30.8%, a difference of 1.5%.
Births to Unmarried Women Correlation Summary
| Measurement | Immigrants from Morocco | British |
| Minimum | 11.8% | 18.3% |
| Maximum | 100.0% | 100.0% |
| Range | 88.2% | 81.7% |
| Mean | 42.4% | 59.4% |
| Median | 30.4% | 54.1% |
| Interquartile 25% (IQ1) | 25.7% | 32.5% |
| Interquartile 75% (IQ3) | 66.7% | 100.0% |
| Interquartile Range (IQR) | 41.0% | 67.5% |
| Standard Deviation (Sample) | 27.4% | 30.1% |
| Standard Deviation (Population) | 26.9% | 29.6% |
Demographics Similar to Immigrants from Morocco and British by Births to Unmarried Women
In terms of births to unmarried women, the demographic groups most similar to Immigrants from Morocco are Immigrants from South Eastern Asia (30.4%, a difference of 0.010%), Brazilian (30.4%, a difference of 0.080%), Immigrants from Scotland (30.4%, a difference of 0.12%), Immigrants from Philippines (30.4%, a difference of 0.25%), and Puget Sound Salish (30.4%, a difference of 0.25%). Similarly, the demographic groups most similar to British are Polish (30.8%, a difference of 0.020%), Italian (30.8%, a difference of 0.13%), Somali (30.7%, a difference of 0.24%), Serbian (30.7%, a difference of 0.39%), and Chilean (30.7%, a difference of 0.43%).
| Demographics | Rating | Rank | Births to Unmarried Women |
| Immigrants | Morocco | 85.2 /100 | #133 | Excellent 30.4% |
| Immigrants | South Eastern Asia | 85.2 /100 | #134 | Excellent 30.4% |
| Brazilians | 84.8 /100 | #135 | Excellent 30.4% |
| Immigrants | Scotland | 84.6 /100 | #136 | Excellent 30.4% |
| Immigrants | Philippines | 83.9 /100 | #137 | Excellent 30.4% |
| Puget Sound Salish | 83.9 /100 | #138 | Excellent 30.4% |
| Immigrants | Canada | 83.7 /100 | #139 | Excellent 30.4% |
| Swiss | 83.1 /100 | #140 | Excellent 30.5% |
| Pakistanis | 83.0 /100 | #141 | Excellent 30.5% |
| South Africans | 82.7 /100 | #142 | Excellent 30.5% |
| Immigrants | Uganda | 82.6 /100 | #143 | Excellent 30.5% |
| Czechs | 82.1 /100 | #144 | Excellent 30.5% |
| Immigrants | North America | 81.5 /100 | #145 | Excellent 30.6% |
| Northern Europeans | 81.4 /100 | #146 | Excellent 30.6% |
| Immigrants | Oceania | 81.2 /100 | #147 | Excellent 30.6% |
| Chileans | 79.1 /100 | #148 | Good 30.7% |
| Serbians | 78.8 /100 | #149 | Good 30.7% |
| Somalis | 77.8 /100 | #150 | Good 30.7% |
| Italians | 77.0 /100 | #151 | Good 30.8% |
| Poles | 76.2 /100 | #152 | Good 30.8% |
| British | 76.0 /100 | #153 | Good 30.8% |