Immigrants from Haiti vs Immigrants from Peru Ambulatory Disability
COMPARE
Immigrants from Haiti
Immigrants from Peru
Ambulatory Disability
Ambulatory Disability Comparison
Immigrants from Haiti
Immigrants from Peru
6.5%
AMBULATORY DISABILITY
1.6/ 100
METRIC RATING
241st/ 347
METRIC RANK
5.7%
AMBULATORY DISABILITY
99.4/ 100
METRIC RATING
71st/ 347
METRIC RANK
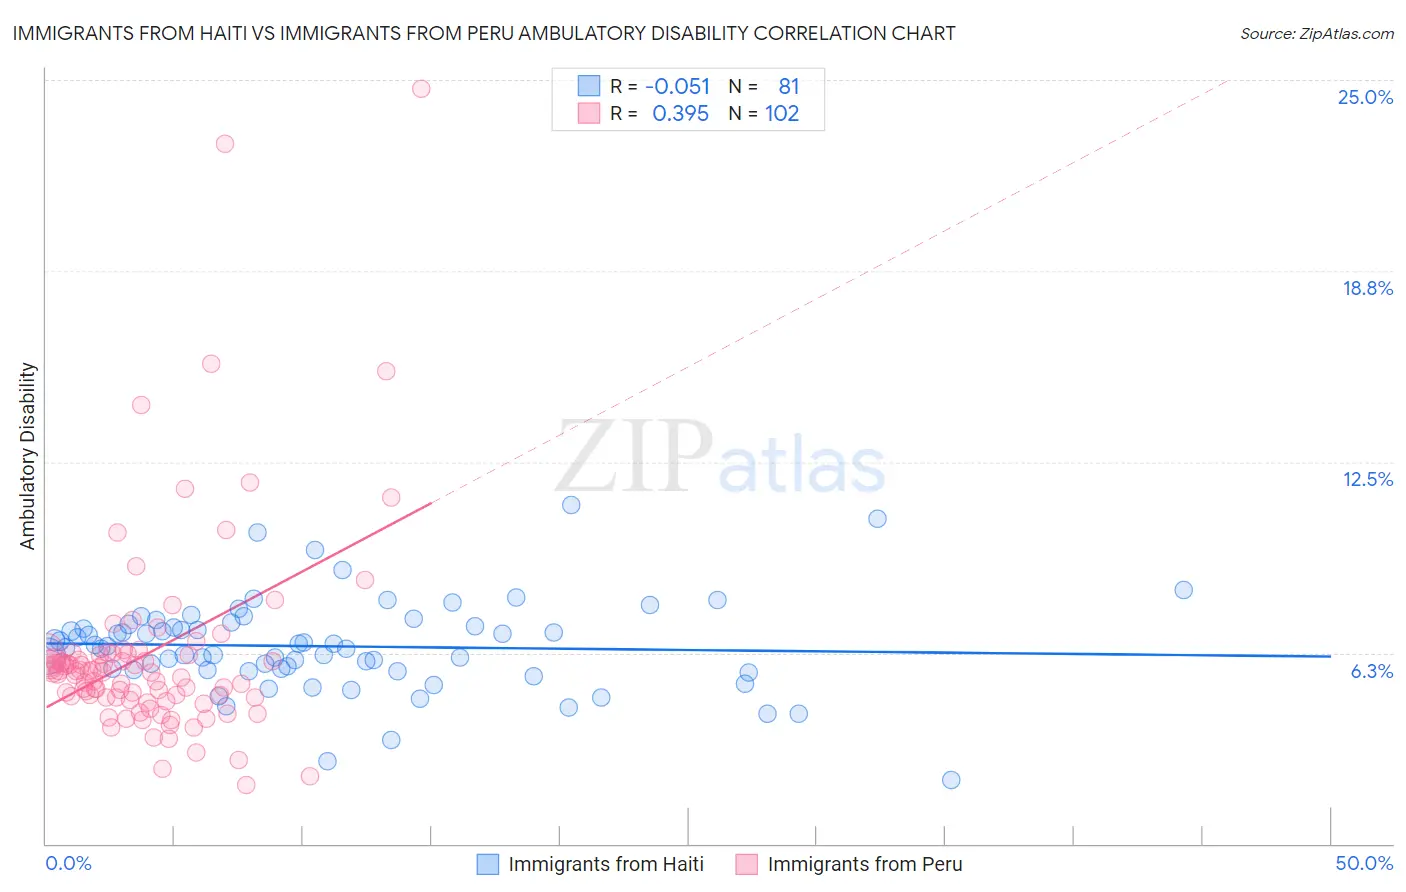
Immigrants from Haiti vs Immigrants from Peru Ambulatory Disability Correlation Chart
The statistical analysis conducted on geographies consisting of 225,209,570 people shows a slight negative correlation between the proportion of Immigrants from Haiti and percentage of population with ambulatory disability in the United States with a correlation coefficient (R) of -0.051 and weighted average of 6.5%. Similarly, the statistical analysis conducted on geographies consisting of 328,808,215 people shows a mild positive correlation between the proportion of Immigrants from Peru and percentage of population with ambulatory disability in the United States with a correlation coefficient (R) of 0.395 and weighted average of 5.7%, a difference of 13.1%.
Ambulatory Disability Correlation Summary
| Measurement | Immigrants from Haiti | Immigrants from Peru |
| Minimum | 2.1% | 1.9% |
| Maximum | 11.1% | 24.7% |
| Range | 9.0% | 22.8% |
| Mean | 6.5% | 6.2% |
| Median | 6.5% | 5.6% |
| Interquartile 25% (IQ1) | 5.7% | 4.8% |
| Interquartile 75% (IQ3) | 7.2% | 6.2% |
| Interquartile Range (IQR) | 1.5% | 1.4% |
| Standard Deviation (Sample) | 1.5% | 3.4% |
| Standard Deviation (Population) | 1.5% | 3.4% |
Similar Demographics by Ambulatory Disability
Demographics Similar to Immigrants from Haiti by Ambulatory Disability
In terms of ambulatory disability, the demographic groups most similar to Immigrants from Haiti are Spaniard (6.5%, a difference of 0.030%), German (6.5%, a difference of 0.050%), Immigrants from Panama (6.5%, a difference of 0.050%), Immigrants from Senegal (6.4%, a difference of 0.080%), and Tlingit-Haida (6.5%, a difference of 0.090%).
| Demographics | Rating | Rank | Ambulatory Disability |
| Immigrants | Liberia | 2.3 /100 | #234 | Tragic 6.4% |
| Hispanics or Latinos | 2.2 /100 | #235 | Tragic 6.4% |
| Dutch | 2.0 /100 | #236 | Tragic 6.4% |
| Immigrants | Germany | 1.8 /100 | #237 | Tragic 6.4% |
| Haitians | 1.8 /100 | #238 | Tragic 6.4% |
| Senegalese | 1.7 /100 | #239 | Tragic 6.4% |
| Immigrants | Senegal | 1.7 /100 | #240 | Tragic 6.4% |
| Immigrants | Haiti | 1.6 /100 | #241 | Tragic 6.5% |
| Spaniards | 1.6 /100 | #242 | Tragic 6.5% |
| Germans | 1.5 /100 | #243 | Tragic 6.5% |
| Immigrants | Panama | 1.5 /100 | #244 | Tragic 6.5% |
| Tlingit-Haida | 1.5 /100 | #245 | Tragic 6.5% |
| Armenians | 1.5 /100 | #246 | Tragic 6.5% |
| Immigrants | Cuba | 1.4 /100 | #247 | Tragic 6.5% |
| Immigrants | Portugal | 1.4 /100 | #248 | Tragic 6.5% |
Demographics Similar to Immigrants from Peru by Ambulatory Disability
In terms of ambulatory disability, the demographic groups most similar to Immigrants from Peru are Brazilian (5.7%, a difference of 0.020%), Immigrants from Northern Africa (5.7%, a difference of 0.040%), Immigrants from Cameroon (5.7%, a difference of 0.040%), Sierra Leonean (5.7%, a difference of 0.090%), and Immigrants from South Africa (5.7%, a difference of 0.090%).
| Demographics | Rating | Rank | Ambulatory Disability |
| Laotians | 99.7 /100 | #64 | Exceptional 5.7% |
| Immigrants | Switzerland | 99.7 /100 | #65 | Exceptional 5.7% |
| Israelis | 99.6 /100 | #66 | Exceptional 5.7% |
| Immigrants | Uganda | 99.6 /100 | #67 | Exceptional 5.7% |
| Sri Lankans | 99.6 /100 | #68 | Exceptional 5.7% |
| Peruvians | 99.5 /100 | #69 | Exceptional 5.7% |
| Sierra Leoneans | 99.4 /100 | #70 | Exceptional 5.7% |
| Immigrants | Peru | 99.4 /100 | #71 | Exceptional 5.7% |
| Brazilians | 99.4 /100 | #72 | Exceptional 5.7% |
| Immigrants | Northern Africa | 99.4 /100 | #73 | Exceptional 5.7% |
| Immigrants | Cameroon | 99.4 /100 | #74 | Exceptional 5.7% |
| Immigrants | South Africa | 99.3 /100 | #75 | Exceptional 5.7% |
| Sudanese | 99.3 /100 | #76 | Exceptional 5.7% |
| Immigrants | Vietnam | 99.3 /100 | #77 | Exceptional 5.7% |
| Somalis | 99.2 /100 | #78 | Exceptional 5.7% |