Immigrants from Guyana vs Immigrants from Bangladesh Average Family Size
COMPARE
Immigrants from Guyana
Immigrants from Bangladesh
Average Family Size
Average Family Size Comparison
Immigrants from Guyana
Immigrants from Bangladesh
3.40
AVERAGE FAMILY SIZE
100.0/ 100
METRIC RATING
36th/ 347
METRIC RANK
3.36
AVERAGE FAMILY SIZE
100.0/ 100
METRIC RATING
50th/ 347
METRIC RANK
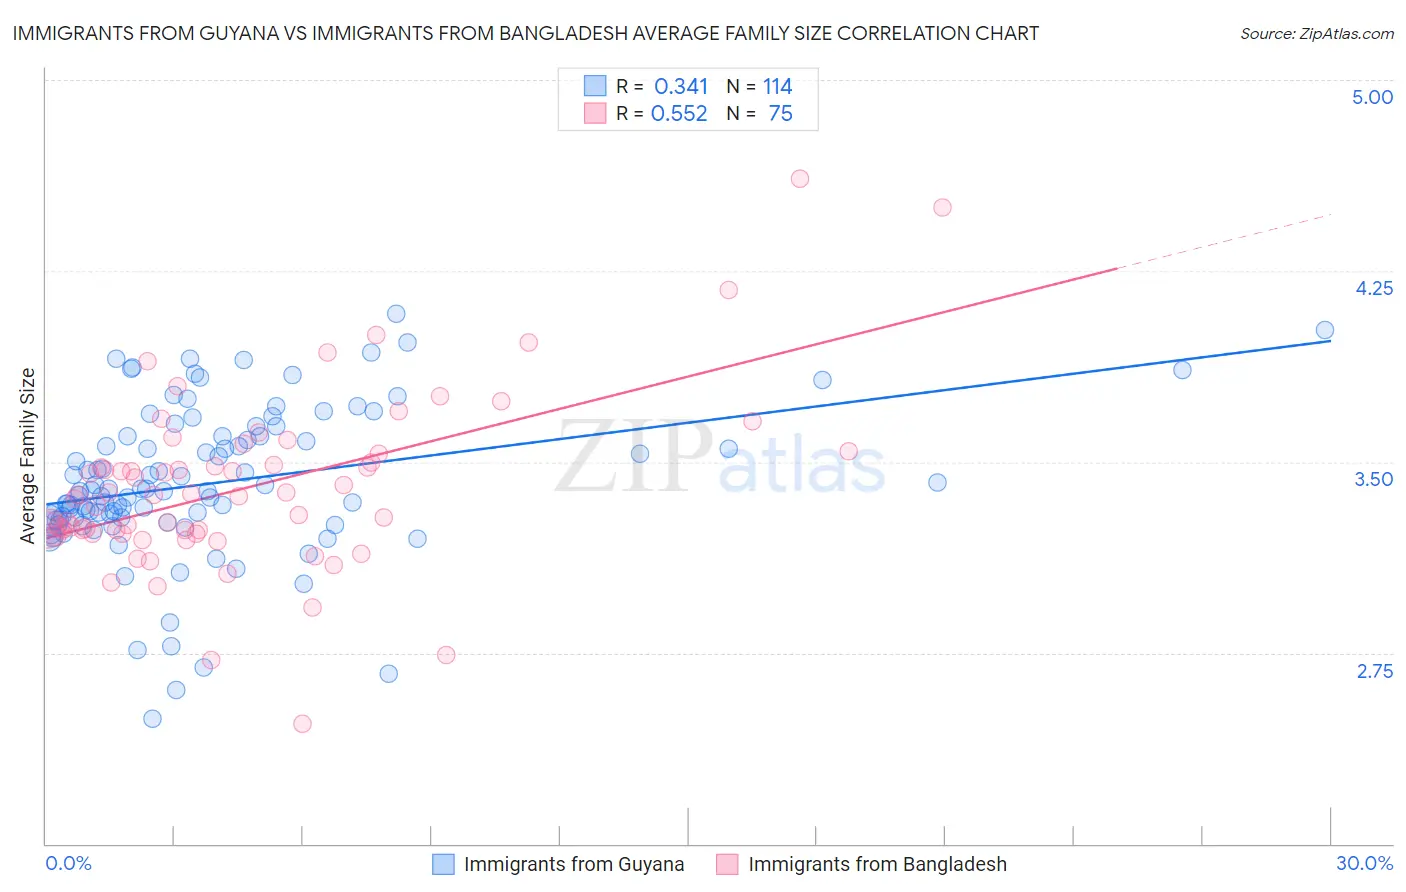
Immigrants from Guyana vs Immigrants from Bangladesh Average Family Size Correlation Chart
The statistical analysis conducted on geographies consisting of 183,692,650 people shows a mild positive correlation between the proportion of Immigrants from Guyana and average family size in the United States with a correlation coefficient (R) of 0.341 and weighted average of 3.40. Similarly, the statistical analysis conducted on geographies consisting of 203,581,680 people shows a substantial positive correlation between the proportion of Immigrants from Bangladesh and average family size in the United States with a correlation coefficient (R) of 0.552 and weighted average of 3.36, a difference of 1.2%.
Average Family Size Correlation Summary
| Measurement | Immigrants from Guyana | Immigrants from Bangladesh |
| Minimum | 2.49 | 2.47 |
| Maximum | 4.08 | 4.61 |
| Range | 1.59 | 2.14 |
| Mean | 3.42 | 3.40 |
| Median | 3.38 | 3.37 |
| Interquartile 25% (IQ1) | 3.27 | 3.22 |
| Interquartile 75% (IQ3) | 3.60 | 3.53 |
| Interquartile Range (IQR) | 0.33 | 0.31 |
| Standard Deviation (Sample) | 0.30 | 0.34 |
| Standard Deviation (Population) | 0.30 | 0.34 |
Demographics Similar to Immigrants from Guyana and Immigrants from Bangladesh by Average Family Size
In terms of average family size, the demographic groups most similar to Immigrants from Guyana are Guatemalan (3.40, a difference of 0.050%), Hispanic or Latino (3.41, a difference of 0.11%), Guyanese (3.40, a difference of 0.14%), Hawaiian (3.41, a difference of 0.16%), and Immigrants from Belize (3.39, a difference of 0.30%). Similarly, the demographic groups most similar to Immigrants from Bangladesh are Nicaraguan (3.36, a difference of 0.070%), Fijian (3.36, a difference of 0.13%), Bangladeshi (3.37, a difference of 0.14%), Korean (3.36, a difference of 0.16%), and Vietnamese (3.37, a difference of 0.20%).
| Demographics | Rating | Rank | Average Family Size |
| Hawaiians | 100.0 /100 | #33 | Exceptional 3.41 |
| Hispanics or Latinos | 100.0 /100 | #34 | Exceptional 3.41 |
| Guatemalans | 100.0 /100 | #35 | Exceptional 3.40 |
| Immigrants | Guyana | 100.0 /100 | #36 | Exceptional 3.40 |
| Guyanese | 100.0 /100 | #37 | Exceptional 3.40 |
| Immigrants | Belize | 100.0 /100 | #38 | Exceptional 3.39 |
| Immigrants | Haiti | 100.0 /100 | #39 | Exceptional 3.39 |
| Belizeans | 100.0 /100 | #40 | Exceptional 3.39 |
| Marshallese | 100.0 /100 | #41 | Exceptional 3.38 |
| Immigrants | Vietnam | 100.0 /100 | #42 | Exceptional 3.38 |
| Immigrants | Philippines | 100.0 /100 | #43 | Exceptional 3.37 |
| Alaska Natives | 100.0 /100 | #44 | Exceptional 3.37 |
| Shoshone | 100.0 /100 | #45 | Exceptional 3.37 |
| Haitians | 100.0 /100 | #46 | Exceptional 3.37 |
| Vietnamese | 100.0 /100 | #47 | Exceptional 3.37 |
| Immigrants | Nicaragua | 100.0 /100 | #48 | Exceptional 3.37 |
| Bangladeshis | 100.0 /100 | #49 | Exceptional 3.37 |
| Immigrants | Bangladesh | 100.0 /100 | #50 | Exceptional 3.36 |
| Nicaraguans | 100.0 /100 | #51 | Exceptional 3.36 |
| Fijians | 100.0 /100 | #52 | Exceptional 3.36 |
| Koreans | 100.0 /100 | #53 | Exceptional 3.36 |