Immigrants from Grenada vs Czech Currently Married
COMPARE
Immigrants from Grenada
Czech
Currently Married
Currently Married Comparison
Immigrants from Grenada
Czechs
39.1%
CURRENTLY MARRIED
0.0/ 100
METRIC RATING
340th/ 347
METRIC RANK
49.9%
CURRENTLY MARRIED
99.9/ 100
METRIC RATING
9th/ 347
METRIC RANK
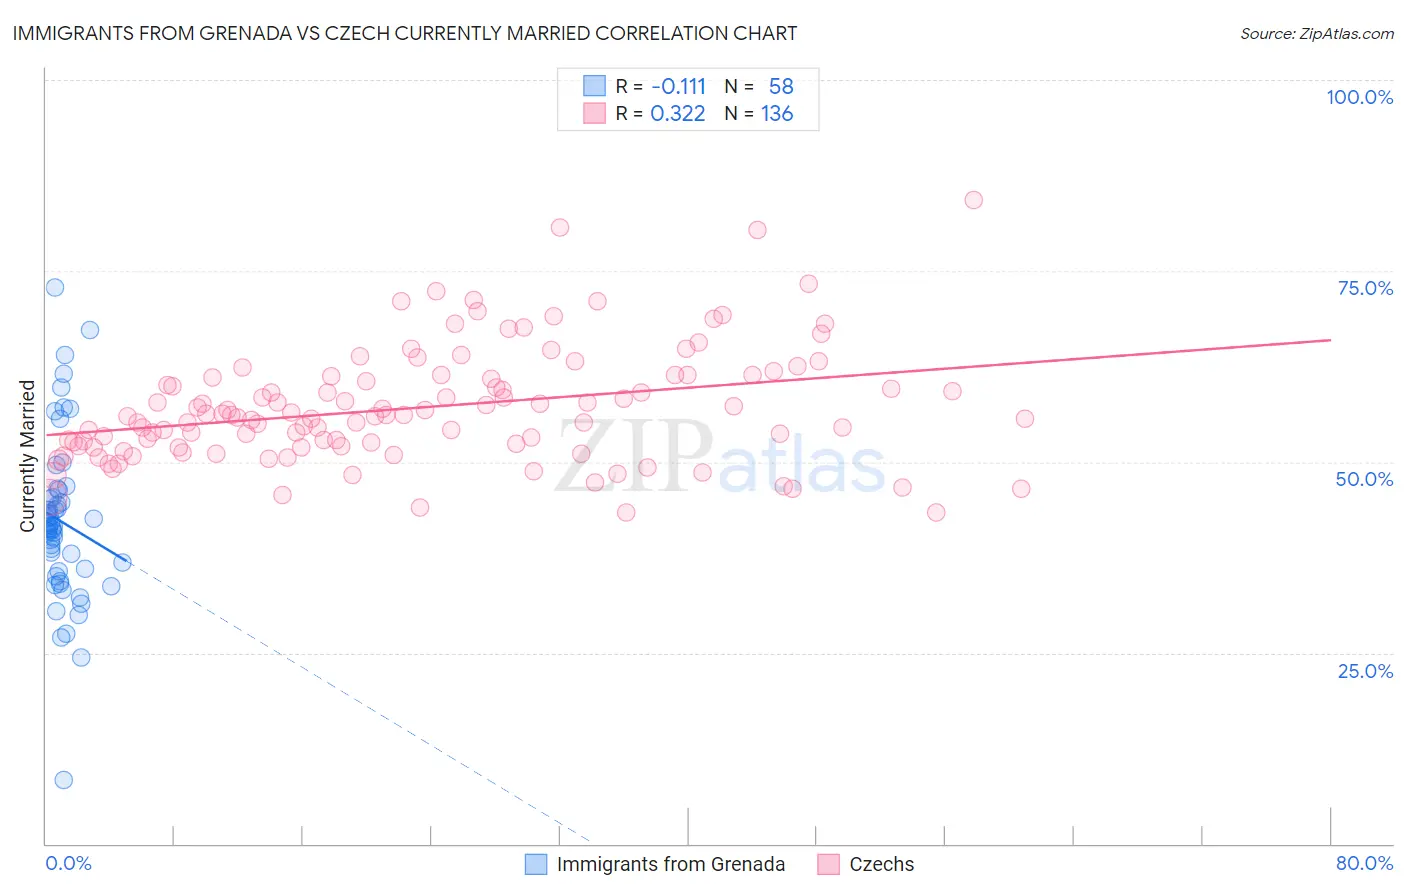
Immigrants from Grenada vs Czech Currently Married Correlation Chart
The statistical analysis conducted on geographies consisting of 67,201,096 people shows a poor negative correlation between the proportion of Immigrants from Grenada and percentage of population currently married in the United States with a correlation coefficient (R) of -0.111 and weighted average of 39.1%. Similarly, the statistical analysis conducted on geographies consisting of 484,743,369 people shows a mild positive correlation between the proportion of Czechs and percentage of population currently married in the United States with a correlation coefficient (R) of 0.322 and weighted average of 49.9%, a difference of 27.4%.
Currently Married Correlation Summary
| Measurement | Immigrants from Grenada | Czech |
| Minimum | 8.3% | 43.4% |
| Maximum | 72.8% | 84.3% |
| Range | 64.5% | 40.9% |
| Mean | 42.2% | 57.1% |
| Median | 41.4% | 56.0% |
| Interquartile 25% (IQ1) | 35.6% | 52.0% |
| Interquartile 75% (IQ3) | 45.4% | 61.1% |
| Interquartile Range (IQR) | 9.8% | 9.1% |
| Standard Deviation (Sample) | 10.9% | 7.5% |
| Standard Deviation (Population) | 10.8% | 7.5% |
Similar Demographics by Currently Married
Demographics Similar to Immigrants from Grenada by Currently Married
In terms of currently married, the demographic groups most similar to Immigrants from Grenada are Navajo (39.0%, a difference of 0.35%), Immigrants from Dominican Republic (38.9%, a difference of 0.52%), Dominican (39.5%, a difference of 0.96%), Cape Verdean (39.6%, a difference of 1.1%), and Black/African American (39.6%, a difference of 1.2%).
| Demographics | Rating | Rank | Currently Married |
| Yup'ik | 0.0 /100 | #333 | Tragic 39.9% |
| Puerto Ricans | 0.0 /100 | #334 | Tragic 39.9% |
| Lumbee | 0.0 /100 | #335 | Tragic 39.8% |
| British West Indians | 0.0 /100 | #336 | Tragic 39.8% |
| Blacks/African Americans | 0.0 /100 | #337 | Tragic 39.6% |
| Cape Verdeans | 0.0 /100 | #338 | Tragic 39.6% |
| Dominicans | 0.0 /100 | #339 | Tragic 39.5% |
| Immigrants | Grenada | 0.0 /100 | #340 | Tragic 39.1% |
| Navajo | 0.0 /100 | #341 | Tragic 39.0% |
| Immigrants | Dominican Republic | 0.0 /100 | #342 | Tragic 38.9% |
| Pueblo | 0.0 /100 | #343 | Tragic 38.2% |
| Immigrants | Cabo Verde | 0.0 /100 | #344 | Tragic 37.8% |
| Tohono O'odham | 0.0 /100 | #345 | Tragic 36.8% |
| Hopi | 0.0 /100 | #346 | Tragic 36.5% |
| Pima | 0.0 /100 | #347 | Tragic 35.9% |
Demographics Similar to Czechs by Currently Married
In terms of currently married, the demographic groups most similar to Czechs are Swedish (50.0%, a difference of 0.19%), Filipino (49.7%, a difference of 0.26%), English (49.7%, a difference of 0.27%), Swiss (49.7%, a difference of 0.27%), and Immigrants from South Central Asia (50.0%, a difference of 0.32%).
| Demographics | Rating | Rank | Currently Married |
| Thais | 100.0 /100 | #2 | Exceptional 50.9% |
| Assyrians/Chaldeans/Syriacs | 100.0 /100 | #3 | Exceptional 50.8% |
| Immigrants | Taiwan | 100.0 /100 | #4 | Exceptional 50.7% |
| Danes | 100.0 /100 | #5 | Exceptional 50.5% |
| Norwegians | 100.0 /100 | #6 | Exceptional 50.2% |
| Immigrants | South Central Asia | 100.0 /100 | #7 | Exceptional 50.0% |
| Swedes | 100.0 /100 | #8 | Exceptional 50.0% |
| Czechs | 99.9 /100 | #9 | Exceptional 49.9% |
| Filipinos | 99.9 /100 | #10 | Exceptional 49.7% |
| English | 99.9 /100 | #11 | Exceptional 49.7% |
| Swiss | 99.9 /100 | #12 | Exceptional 49.7% |
| Dutch | 99.9 /100 | #13 | Exceptional 49.6% |
| Germans | 99.9 /100 | #14 | Exceptional 49.6% |
| Pennsylvania Germans | 99.9 /100 | #15 | Exceptional 49.6% |
| Chinese | 99.9 /100 | #16 | Exceptional 49.5% |