Immigrants from France vs Jamaican Divorced or Separated
COMPARE
Immigrants from France
Jamaican
Divorced or Separated
Divorced or Separated Comparison
Immigrants from France
Jamaicans
11.7%
DIVORCED OR SEPARATED
96.6/ 100
METRIC RATING
112th/ 347
METRIC RANK
12.9%
DIVORCED OR SEPARATED
0.0/ 100
METRIC RATING
293rd/ 347
METRIC RANK
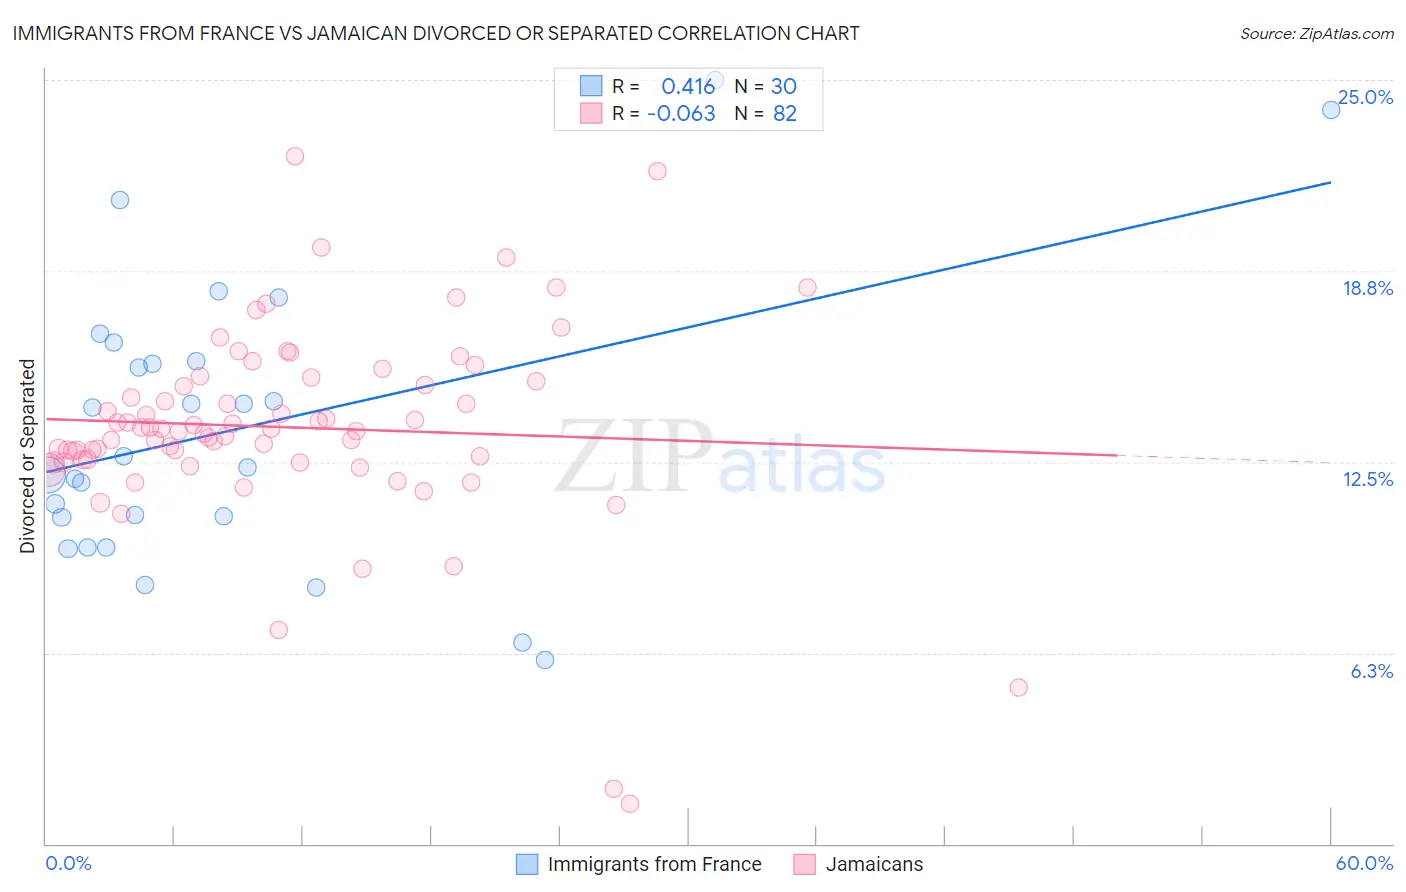
Immigrants from France vs Jamaican Divorced or Separated Correlation Chart
The statistical analysis conducted on geographies consisting of 287,864,701 people shows a moderate positive correlation between the proportion of Immigrants from France and percentage of population currently divorced or separated in the United States with a correlation coefficient (R) of 0.416 and weighted average of 11.7%. Similarly, the statistical analysis conducted on geographies consisting of 367,802,354 people shows a slight negative correlation between the proportion of Jamaicans and percentage of population currently divorced or separated in the United States with a correlation coefficient (R) of -0.063 and weighted average of 12.9%, a difference of 10.5%.
Divorced or Separated Correlation Summary
| Measurement | Immigrants from France | Jamaican |
| Minimum | 6.0% | 1.3% |
| Maximum | 25.0% | 22.5% |
| Range | 19.0% | 21.2% |
| Mean | 13.6% | 13.6% |
| Median | 12.5% | 13.5% |
| Interquartile 25% (IQ1) | 10.7% | 12.6% |
| Interquartile 75% (IQ3) | 15.8% | 15.2% |
| Interquartile Range (IQR) | 5.1% | 2.6% |
| Standard Deviation (Sample) | 4.6% | 3.3% |
| Standard Deviation (Population) | 4.5% | 3.3% |
Similar Demographics by Divorced or Separated
Demographics Similar to Immigrants from France by Divorced or Separated
In terms of divorced or separated, the demographic groups most similar to Immigrants from France are Estonian (11.7%, a difference of 0.0%), Immigrants from Spain (11.7%, a difference of 0.050%), Immigrants from South Africa (11.7%, a difference of 0.090%), Immigrants from Czechoslovakia (11.7%, a difference of 0.090%), and Greek (11.7%, a difference of 0.10%).
| Demographics | Rating | Rank | Divorced or Separated |
| Immigrants | El Salvador | 97.9 /100 | #105 | Exceptional 11.7% |
| Immigrants | Kazakhstan | 97.8 /100 | #106 | Exceptional 11.7% |
| Native Hawaiians | 97.2 /100 | #107 | Exceptional 11.7% |
| Greeks | 96.9 /100 | #108 | Exceptional 11.7% |
| Immigrants | South Africa | 96.9 /100 | #109 | Exceptional 11.7% |
| Immigrants | Czechoslovakia | 96.9 /100 | #110 | Exceptional 11.7% |
| Immigrants | Spain | 96.8 /100 | #111 | Exceptional 11.7% |
| Immigrants | France | 96.6 /100 | #112 | Exceptional 11.7% |
| Estonians | 96.6 /100 | #113 | Exceptional 11.7% |
| Immigrants | Norway | 95.9 /100 | #114 | Exceptional 11.7% |
| Lithuanians | 95.7 /100 | #115 | Exceptional 11.7% |
| Immigrants | Iraq | 95.4 /100 | #116 | Exceptional 11.7% |
| Immigrants | Uganda | 95.3 /100 | #117 | Exceptional 11.7% |
| Ecuadorians | 95.3 /100 | #118 | Exceptional 11.7% |
| Syrians | 95.1 /100 | #119 | Exceptional 11.7% |
Demographics Similar to Jamaicans by Divorced or Separated
In terms of divorced or separated, the demographic groups most similar to Jamaicans are Apache (12.9%, a difference of 0.030%), Celtic (13.0%, a difference of 0.16%), Scotch-Irish (12.9%, a difference of 0.21%), Immigrants from Honduras (12.9%, a difference of 0.27%), and Pima (12.9%, a difference of 0.38%).
| Demographics | Rating | Rank | Divorced or Separated |
| Spanish | 0.1 /100 | #286 | Tragic 12.8% |
| Hondurans | 0.1 /100 | #287 | Tragic 12.8% |
| French Canadians | 0.1 /100 | #288 | Tragic 12.8% |
| Iroquois | 0.0 /100 | #289 | Tragic 12.9% |
| Pima | 0.0 /100 | #290 | Tragic 12.9% |
| Immigrants | Honduras | 0.0 /100 | #291 | Tragic 12.9% |
| Scotch-Irish | 0.0 /100 | #292 | Tragic 12.9% |
| Jamaicans | 0.0 /100 | #293 | Tragic 12.9% |
| Apache | 0.0 /100 | #294 | Tragic 12.9% |
| Celtics | 0.0 /100 | #295 | Tragic 13.0% |
| Nicaraguans | 0.0 /100 | #296 | Tragic 13.0% |
| Natives/Alaskans | 0.0 /100 | #297 | Tragic 13.0% |
| Venezuelans | 0.0 /100 | #298 | Tragic 13.0% |
| Immigrants | Jamaica | 0.0 /100 | #299 | Tragic 13.0% |
| Immigrants | Cabo Verde | 0.0 /100 | #300 | Tragic 13.1% |