Immigrants from Fiji vs Sri Lankan Family Households with Children
COMPARE
Immigrants from Fiji
Sri Lankan
Family Households with Children
Family Households with Children Comparison
Immigrants from Fiji
Sri Lankans
30.5%
FAMILY HOUSEHOLDS WITH CHILDREN
100.0/ 100
METRIC RATING
10th/ 347
METRIC RANK
29.5%
FAMILY HOUSEHOLDS WITH CHILDREN
100.0/ 100
METRIC RATING
26th/ 347
METRIC RANK
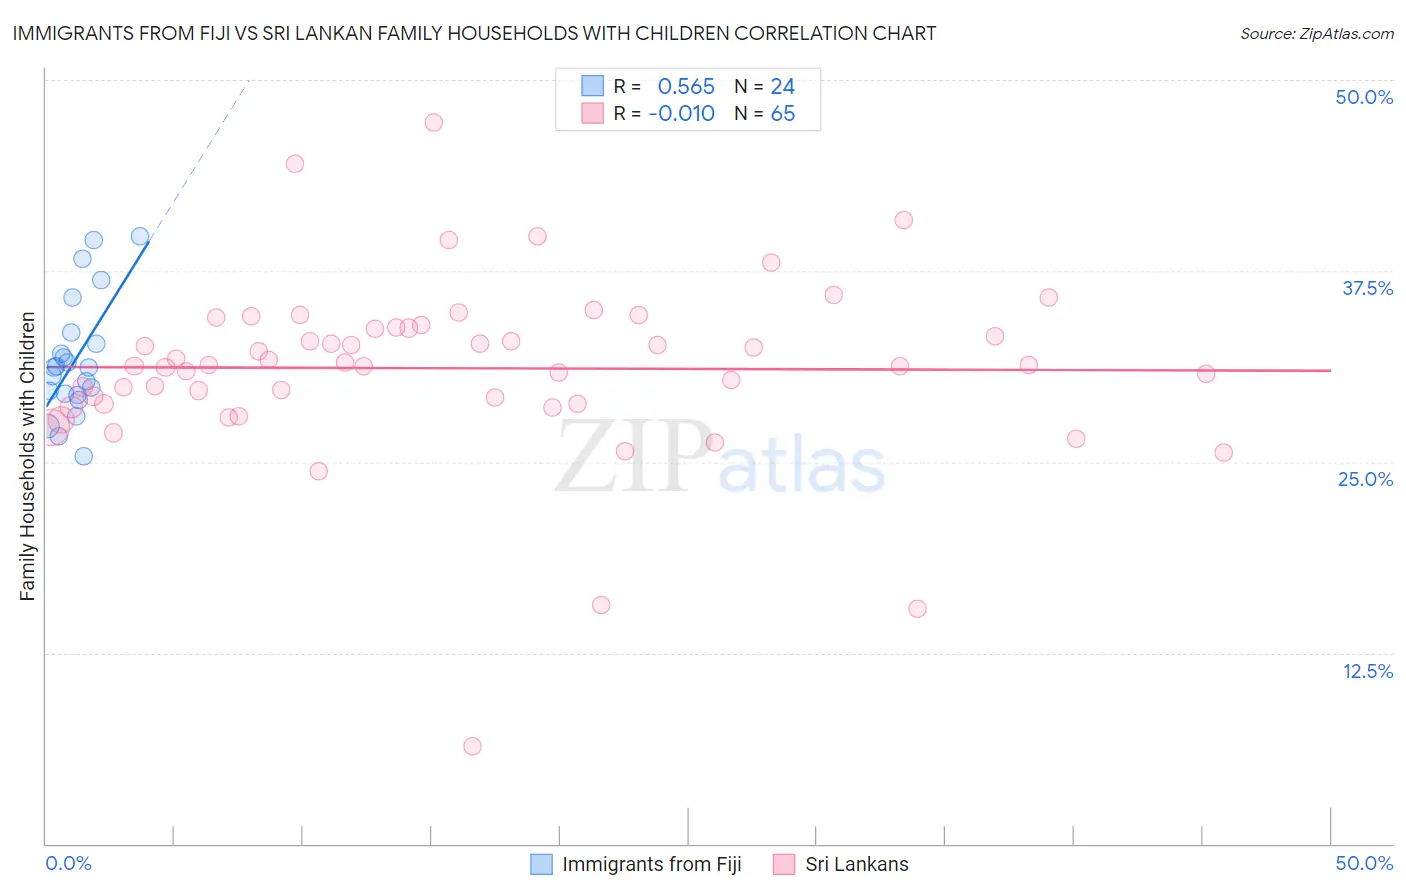
Immigrants from Fiji vs Sri Lankan Family Households with Children Correlation Chart
The statistical analysis conducted on geographies consisting of 93,754,712 people shows a substantial positive correlation between the proportion of Immigrants from Fiji and percentage of family households with children in the United States with a correlation coefficient (R) of 0.565 and weighted average of 30.5%. Similarly, the statistical analysis conducted on geographies consisting of 439,896,469 people shows no correlation between the proportion of Sri Lankans and percentage of family households with children in the United States with a correlation coefficient (R) of -0.010 and weighted average of 29.5%, a difference of 3.4%.
Family Households with Children Correlation Summary
| Measurement | Immigrants from Fiji | Sri Lankan |
| Minimum | 25.4% | 6.4% |
| Maximum | 39.8% | 47.2% |
| Range | 14.4% | 40.8% |
| Mean | 31.7% | 31.1% |
| Median | 31.2% | 31.3% |
| Interquartile 25% (IQ1) | 29.4% | 28.8% |
| Interquartile 75% (IQ3) | 33.1% | 33.8% |
| Interquartile Range (IQR) | 3.6% | 5.0% |
| Standard Deviation (Sample) | 3.9% | 5.9% |
| Standard Deviation (Population) | 3.8% | 5.9% |
Demographics Similar to Immigrants from Fiji and Sri Lankans by Family Households with Children
In terms of family households with children, the demographic groups most similar to Immigrants from Fiji are Nepalese (30.5%, a difference of 0.080%), Thai (30.6%, a difference of 0.32%), Yakama (30.8%, a difference of 0.80%), Immigrants from Pakistan (30.2%, a difference of 0.96%), and Afghan (30.2%, a difference of 1.2%). Similarly, the demographic groups most similar to Sri Lankans are Immigrants from Vietnam (29.5%, a difference of 0.030%), Samoan (29.5%, a difference of 0.18%), Immigrants from Latin America (29.7%, a difference of 0.44%), Guamanian/Chamorro (29.7%, a difference of 0.54%), and Mexican American Indian (29.7%, a difference of 0.64%).
| Demographics | Rating | Rank | Family Households with Children |
| Yakama | 100.0 /100 | #8 | Exceptional 30.8% |
| Thais | 100.0 /100 | #9 | Exceptional 30.6% |
| Immigrants | Fiji | 100.0 /100 | #10 | Exceptional 30.5% |
| Nepalese | 100.0 /100 | #11 | Exceptional 30.5% |
| Immigrants | Pakistan | 100.0 /100 | #12 | Exceptional 30.2% |
| Afghans | 100.0 /100 | #13 | Exceptional 30.2% |
| Bangladeshis | 100.0 /100 | #14 | Exceptional 30.1% |
| Immigrants | South Central Asia | 100.0 /100 | #15 | Exceptional 30.0% |
| Immigrants | Afghanistan | 100.0 /100 | #16 | Exceptional 30.0% |
| Hispanics or Latinos | 100.0 /100 | #17 | Exceptional 29.9% |
| Salvadorans | 100.0 /100 | #18 | Exceptional 29.9% |
| Alaska Natives | 100.0 /100 | #19 | Exceptional 29.9% |
| Immigrants | El Salvador | 100.0 /100 | #20 | Exceptional 29.8% |
| Immigrants | Laos | 100.0 /100 | #21 | Exceptional 29.8% |
| Malaysians | 100.0 /100 | #22 | Exceptional 29.8% |
| Mexican American Indians | 100.0 /100 | #23 | Exceptional 29.7% |
| Guamanians/Chamorros | 100.0 /100 | #24 | Exceptional 29.7% |
| Immigrants | Latin America | 100.0 /100 | #25 | Exceptional 29.7% |
| Sri Lankans | 100.0 /100 | #26 | Exceptional 29.5% |
| Immigrants | Vietnam | 100.0 /100 | #27 | Exceptional 29.5% |
| Samoans | 100.0 /100 | #28 | Exceptional 29.5% |