Immigrants from Portugal vs Sri Lankan Family Households with Children
COMPARE
Immigrants from Portugal
Sri Lankan
Family Households with Children
Family Households with Children Comparison
Immigrants from Portugal
Sri Lankans
27.7%
FAMILY HOUSEHOLDS WITH CHILDREN
84.1/ 100
METRIC RATING
136th/ 347
METRIC RANK
29.5%
FAMILY HOUSEHOLDS WITH CHILDREN
100.0/ 100
METRIC RATING
26th/ 347
METRIC RANK
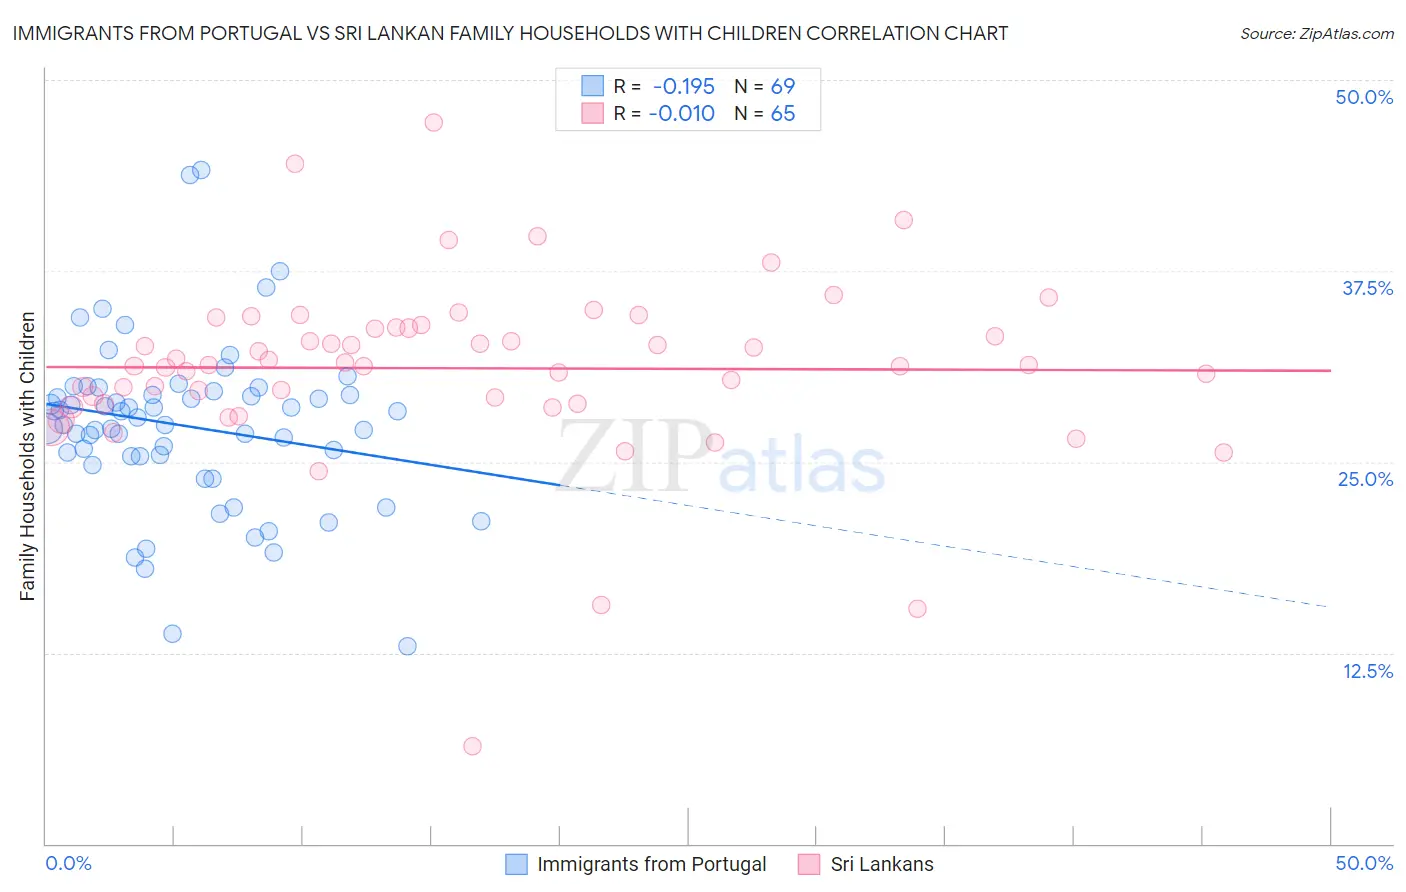
Immigrants from Portugal vs Sri Lankan Family Households with Children Correlation Chart
The statistical analysis conducted on geographies consisting of 174,702,981 people shows a poor negative correlation between the proportion of Immigrants from Portugal and percentage of family households with children in the United States with a correlation coefficient (R) of -0.195 and weighted average of 27.7%. Similarly, the statistical analysis conducted on geographies consisting of 439,896,469 people shows no correlation between the proportion of Sri Lankans and percentage of family households with children in the United States with a correlation coefficient (R) of -0.010 and weighted average of 29.5%, a difference of 6.7%.
Family Households with Children Correlation Summary
| Measurement | Immigrants from Portugal | Sri Lankan |
| Minimum | 12.9% | 6.4% |
| Maximum | 44.1% | 47.2% |
| Range | 31.2% | 40.8% |
| Mean | 27.4% | 31.1% |
| Median | 27.9% | 31.3% |
| Interquartile 25% (IQ1) | 25.4% | 28.8% |
| Interquartile 75% (IQ3) | 29.5% | 33.8% |
| Interquartile Range (IQR) | 4.1% | 5.0% |
| Standard Deviation (Sample) | 5.5% | 5.9% |
| Standard Deviation (Population) | 5.4% | 5.9% |
Similar Demographics by Family Households with Children
Demographics Similar to Immigrants from Portugal by Family Households with Children
In terms of family households with children, the demographic groups most similar to Immigrants from Portugal are Immigrants from Dominican Republic (27.7%, a difference of 0.010%), Immigrants from Ecuador (27.7%, a difference of 0.020%), Immigrants from Panama (27.7%, a difference of 0.030%), Iranian (27.7%, a difference of 0.040%), and Uruguayan (27.7%, a difference of 0.040%).
| Demographics | Rating | Rank | Family Households with Children |
| Immigrants | Eritrea | 89.4 /100 | #129 | Excellent 27.8% |
| Cajuns | 87.6 /100 | #130 | Excellent 27.7% |
| Lebanese | 87.4 /100 | #131 | Excellent 27.7% |
| Immigrants | Belize | 85.7 /100 | #132 | Excellent 27.7% |
| Iranians | 85.2 /100 | #133 | Excellent 27.7% |
| Immigrants | Panama | 84.9 /100 | #134 | Excellent 27.7% |
| Immigrants | Ecuador | 84.6 /100 | #135 | Excellent 27.7% |
| Immigrants | Portugal | 84.1 /100 | #136 | Excellent 27.7% |
| Immigrants | Dominican Republic | 83.9 /100 | #137 | Excellent 27.7% |
| Uruguayans | 83.2 /100 | #138 | Excellent 27.7% |
| Vietnamese | 82.6 /100 | #139 | Excellent 27.7% |
| Spanish | 81.8 /100 | #140 | Excellent 27.7% |
| Immigrants | Eastern Asia | 81.7 /100 | #141 | Excellent 27.7% |
| Swiss | 81.4 /100 | #142 | Excellent 27.7% |
| Immigrants | Eastern Africa | 80.2 /100 | #143 | Excellent 27.7% |
Demographics Similar to Sri Lankans by Family Households with Children
In terms of family households with children, the demographic groups most similar to Sri Lankans are Immigrants from Vietnam (29.5%, a difference of 0.030%), Samoan (29.5%, a difference of 0.18%), Bolivian (29.5%, a difference of 0.19%), Yuman (29.5%, a difference of 0.22%), and Japanese (29.4%, a difference of 0.36%).
| Demographics | Rating | Rank | Family Households with Children |
| Alaska Natives | 100.0 /100 | #19 | Exceptional 29.9% |
| Immigrants | El Salvador | 100.0 /100 | #20 | Exceptional 29.8% |
| Immigrants | Laos | 100.0 /100 | #21 | Exceptional 29.8% |
| Malaysians | 100.0 /100 | #22 | Exceptional 29.8% |
| Mexican American Indians | 100.0 /100 | #23 | Exceptional 29.7% |
| Guamanians/Chamorros | 100.0 /100 | #24 | Exceptional 29.7% |
| Immigrants | Latin America | 100.0 /100 | #25 | Exceptional 29.7% |
| Sri Lankans | 100.0 /100 | #26 | Exceptional 29.5% |
| Immigrants | Vietnam | 100.0 /100 | #27 | Exceptional 29.5% |
| Samoans | 100.0 /100 | #28 | Exceptional 29.5% |
| Bolivians | 100.0 /100 | #29 | Exceptional 29.5% |
| Yuman | 100.0 /100 | #30 | Exceptional 29.5% |
| Japanese | 100.0 /100 | #31 | Exceptional 29.4% |
| Immigrants | Yemen | 100.0 /100 | #32 | Exceptional 29.4% |
| Venezuelans | 100.0 /100 | #33 | Exceptional 29.4% |