Immigrants from Europe vs Immigrants from Burma/Myanmar Married-couple Households
COMPARE
Immigrants from Europe
Immigrants from Burma/Myanmar
Married-couple Households
Married-couple Households Comparison
Immigrants from Europe
Immigrants from Burma/Myanmar
47.6%
MARRIED-COUPLE HOUSEHOLDS
93.7/ 100
METRIC RATING
114th/ 347
METRIC RANK
43.4%
MARRIED-COUPLE HOUSEHOLDS
0.1/ 100
METRIC RATING
268th/ 347
METRIC RANK
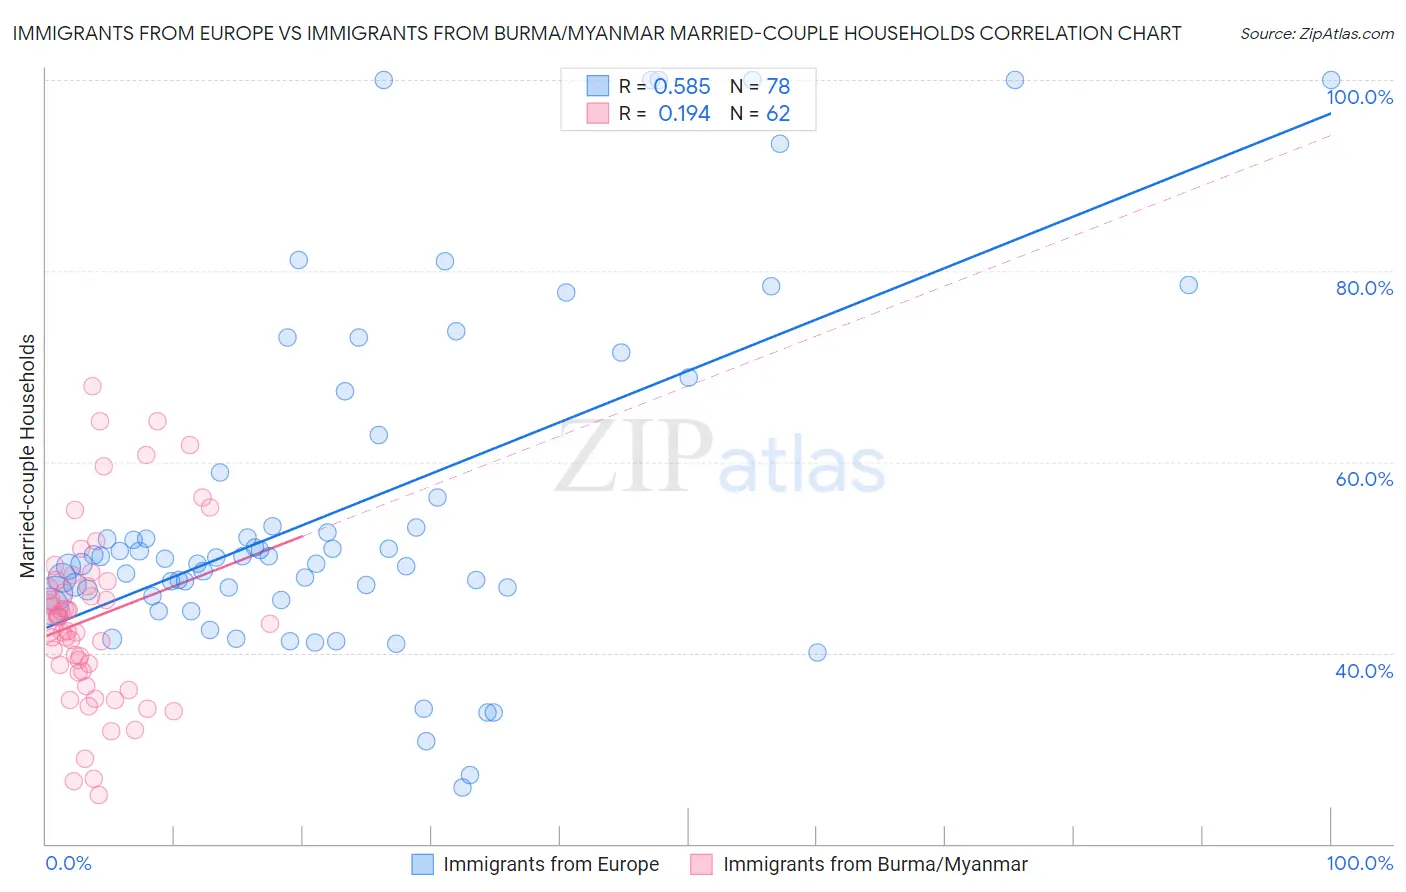
Immigrants from Europe vs Immigrants from Burma/Myanmar Married-couple Households Correlation Chart
The statistical analysis conducted on geographies consisting of 546,870,459 people shows a substantial positive correlation between the proportion of Immigrants from Europe and percentage of married-couple family households in the United States with a correlation coefficient (R) of 0.585 and weighted average of 47.6%. Similarly, the statistical analysis conducted on geographies consisting of 172,267,082 people shows a poor positive correlation between the proportion of Immigrants from Burma/Myanmar and percentage of married-couple family households in the United States with a correlation coefficient (R) of 0.194 and weighted average of 43.4%, a difference of 9.7%.
Married-couple Households Correlation Summary
| Measurement | Immigrants from Europe | Immigrants from Burma/Myanmar |
| Minimum | 25.9% | 25.1% |
| Maximum | 100.0% | 67.9% |
| Range | 74.1% | 42.8% |
| Mean | 55.4% | 43.6% |
| Median | 49.9% | 43.4% |
| Interquartile 25% (IQ1) | 46.2% | 38.0% |
| Interquartile 75% (IQ3) | 58.8% | 47.5% |
| Interquartile Range (IQR) | 12.6% | 9.4% |
| Standard Deviation (Sample) | 18.1% | 9.2% |
| Standard Deviation (Population) | 18.0% | 9.2% |
Similar Demographics by Married-couple Households
Demographics Similar to Immigrants from Europe by Married-couple Households
In terms of married-couple households, the demographic groups most similar to Immigrants from Europe are Venezuelan (47.6%, a difference of 0.010%), Peruvian (47.6%, a difference of 0.020%), Macedonian (47.6%, a difference of 0.030%), Syrian (47.6%, a difference of 0.030%), and Immigrants from Jordan (47.7%, a difference of 0.060%).
| Demographics | Rating | Rank | Married-couple Households |
| Estonians | 94.7 /100 | #107 | Exceptional 47.7% |
| Immigrants | Japan | 94.4 /100 | #108 | Exceptional 47.7% |
| Immigrants | Jordan | 94.1 /100 | #109 | Exceptional 47.7% |
| Macedonians | 93.9 /100 | #110 | Exceptional 47.6% |
| Syrians | 93.9 /100 | #111 | Exceptional 47.6% |
| Peruvians | 93.8 /100 | #112 | Exceptional 47.6% |
| Venezuelans | 93.8 /100 | #113 | Exceptional 47.6% |
| Immigrants | Europe | 93.7 /100 | #114 | Exceptional 47.6% |
| Slovaks | 92.9 /100 | #115 | Exceptional 47.6% |
| Argentineans | 92.5 /100 | #116 | Exceptional 47.5% |
| French Canadians | 92.4 /100 | #117 | Exceptional 47.5% |
| Immigrants | Germany | 92.4 /100 | #118 | Exceptional 47.5% |
| Chileans | 92.2 /100 | #119 | Exceptional 47.5% |
| Puget Sound Salish | 90.5 /100 | #120 | Exceptional 47.4% |
| Immigrants | Eastern Europe | 90.3 /100 | #121 | Exceptional 47.4% |
Demographics Similar to Immigrants from Burma/Myanmar by Married-couple Households
In terms of married-couple households, the demographic groups most similar to Immigrants from Burma/Myanmar are Native/Alaskan (43.5%, a difference of 0.10%), Ecuadorian (43.5%, a difference of 0.15%), Moroccan (43.5%, a difference of 0.20%), Immigrants from Sierra Leone (43.3%, a difference of 0.21%), and Yuman (43.3%, a difference of 0.25%).
| Demographics | Rating | Rank | Married-couple Households |
| Alaskan Athabascans | 0.2 /100 | #261 | Tragic 43.6% |
| Vietnamese | 0.2 /100 | #262 | Tragic 43.6% |
| Cree | 0.1 /100 | #263 | Tragic 43.6% |
| Bangladeshis | 0.1 /100 | #264 | Tragic 43.5% |
| Moroccans | 0.1 /100 | #265 | Tragic 43.5% |
| Ecuadorians | 0.1 /100 | #266 | Tragic 43.5% |
| Natives/Alaskans | 0.1 /100 | #267 | Tragic 43.5% |
| Immigrants | Burma/Myanmar | 0.1 /100 | #268 | Tragic 43.4% |
| Immigrants | Sierra Leone | 0.1 /100 | #269 | Tragic 43.3% |
| Yuman | 0.1 /100 | #270 | Tragic 43.3% |
| Guatemalans | 0.1 /100 | #271 | Tragic 43.3% |
| Immigrants | Nigeria | 0.1 /100 | #272 | Tragic 43.2% |
| Ethiopians | 0.1 /100 | #273 | Tragic 43.2% |
| Nigerians | 0.1 /100 | #274 | Tragic 43.2% |
| Immigrants | Bangladesh | 0.0 /100 | #275 | Tragic 43.1% |