Immigrants from Europe vs Immigrants from Egypt Divorced or Separated
COMPARE
Immigrants from Europe
Immigrants from Egypt
Divorced or Separated
Divorced or Separated Comparison
Immigrants from Europe
Immigrants from Egypt
11.6%
DIVORCED OR SEPARATED
99.2/ 100
METRIC RATING
88th/ 347
METRIC RANK
11.1%
DIVORCED OR SEPARATED
100.0/ 100
METRIC RATING
39th/ 347
METRIC RANK
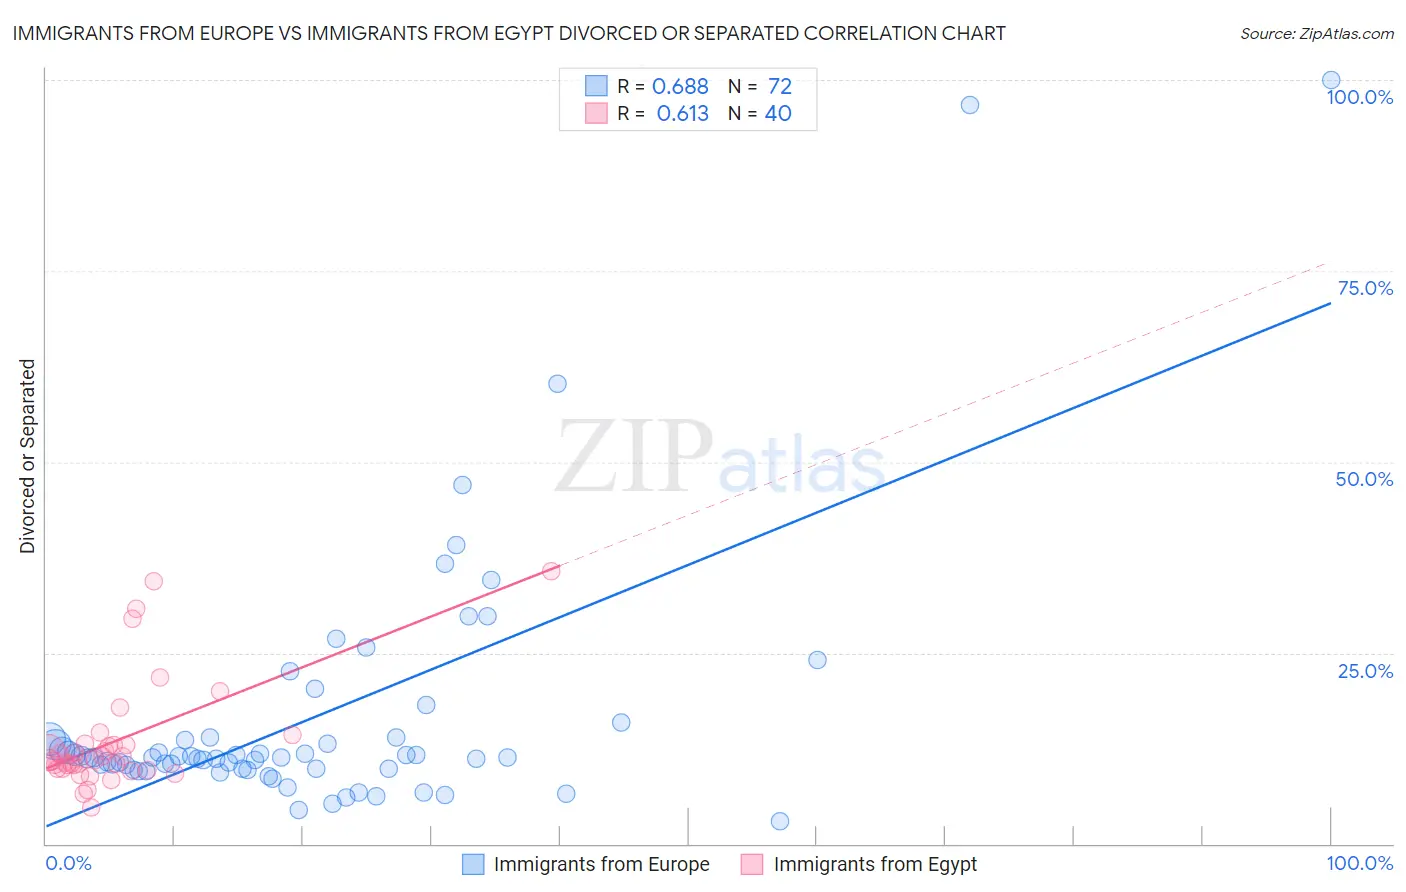
Immigrants from Europe vs Immigrants from Egypt Divorced or Separated Correlation Chart
The statistical analysis conducted on geographies consisting of 547,048,453 people shows a significant positive correlation between the proportion of Immigrants from Europe and percentage of population currently divorced or separated in the United States with a correlation coefficient (R) of 0.688 and weighted average of 11.6%. Similarly, the statistical analysis conducted on geographies consisting of 245,438,594 people shows a significant positive correlation between the proportion of Immigrants from Egypt and percentage of population currently divorced or separated in the United States with a correlation coefficient (R) of 0.613 and weighted average of 11.1%, a difference of 3.8%.
Divorced or Separated Correlation Summary
| Measurement | Immigrants from Europe | Immigrants from Egypt |
| Minimum | 3.0% | 4.8% |
| Maximum | 100.0% | 35.7% |
| Range | 97.0% | 30.9% |
| Mean | 16.6% | 13.5% |
| Median | 11.3% | 10.9% |
| Interquartile 25% (IQ1) | 9.8% | 9.8% |
| Interquartile 75% (IQ3) | 13.8% | 13.0% |
| Interquartile Range (IQR) | 4.0% | 3.2% |
| Standard Deviation (Sample) | 17.1% | 7.2% |
| Standard Deviation (Population) | 17.0% | 7.1% |
Similar Demographics by Divorced or Separated
Demographics Similar to Immigrants from Europe by Divorced or Separated
In terms of divorced or separated, the demographic groups most similar to Immigrants from Europe are Immigrants from Nepal (11.6%, a difference of 0.030%), Immigrants from Southern Europe (11.6%, a difference of 0.040%), Immigrants from Latvia (11.6%, a difference of 0.050%), Immigrants from Albania (11.5%, a difference of 0.12%), and Zimbabwean (11.6%, a difference of 0.14%).
| Demographics | Rating | Rank | Divorced or Separated |
| Russians | 99.4 /100 | #81 | Exceptional 11.5% |
| Immigrants | Romania | 99.3 /100 | #82 | Exceptional 11.5% |
| Immigrants | Bulgaria | 99.3 /100 | #83 | Exceptional 11.5% |
| Bulgarians | 99.3 /100 | #84 | Exceptional 11.5% |
| Immigrants | Albania | 99.3 /100 | #85 | Exceptional 11.5% |
| Immigrants | Latvia | 99.2 /100 | #86 | Exceptional 11.6% |
| Immigrants | Nepal | 99.2 /100 | #87 | Exceptional 11.6% |
| Immigrants | Europe | 99.2 /100 | #88 | Exceptional 11.6% |
| Immigrants | Southern Europe | 99.1 /100 | #89 | Exceptional 11.6% |
| Zimbabweans | 99.0 /100 | #90 | Exceptional 11.6% |
| Spanish American Indians | 99.0 /100 | #91 | Exceptional 11.6% |
| Immigrants | Denmark | 98.9 /100 | #92 | Exceptional 11.6% |
| Arabs | 98.9 /100 | #93 | Exceptional 11.6% |
| Immigrants | Fiji | 98.9 /100 | #94 | Exceptional 11.6% |
| Immigrants | Serbia | 98.8 /100 | #95 | Exceptional 11.6% |
Demographics Similar to Immigrants from Egypt by Divorced or Separated
In terms of divorced or separated, the demographic groups most similar to Immigrants from Egypt are Soviet Union (11.1%, a difference of 0.090%), Immigrants from Greece (11.1%, a difference of 0.24%), Immigrants from Lebanon (11.1%, a difference of 0.30%), Immigrants from Japan (11.1%, a difference of 0.31%), and Bhutanese (11.2%, a difference of 0.36%).
| Demographics | Rating | Rank | Divorced or Separated |
| Tongans | 100.0 /100 | #32 | Exceptional 11.1% |
| Egyptians | 100.0 /100 | #33 | Exceptional 11.1% |
| Immigrants | Uzbekistan | 100.0 /100 | #34 | Exceptional 11.1% |
| Cambodians | 100.0 /100 | #35 | Exceptional 11.1% |
| Immigrants | Japan | 100.0 /100 | #36 | Exceptional 11.1% |
| Immigrants | Lebanon | 100.0 /100 | #37 | Exceptional 11.1% |
| Immigrants | Greece | 100.0 /100 | #38 | Exceptional 11.1% |
| Immigrants | Egypt | 100.0 /100 | #39 | Exceptional 11.1% |
| Soviet Union | 100.0 /100 | #40 | Exceptional 11.1% |
| Bhutanese | 100.0 /100 | #41 | Exceptional 11.2% |
| Chinese | 100.0 /100 | #42 | Exceptional 11.2% |
| Immigrants | Belarus | 100.0 /100 | #43 | Exceptional 11.2% |
| Immigrants | Western Asia | 100.0 /100 | #44 | Exceptional 11.2% |
| Turks | 100.0 /100 | #45 | Exceptional 11.2% |
| Laotians | 100.0 /100 | #46 | Exceptional 11.2% |