Immigrants from Ethiopia vs Bulgarian Unemployment Among Ages 25 to 29 years
COMPARE
Immigrants from Ethiopia
Bulgarian
Unemployment Among Ages 25 to 29 years
Unemployment Among Ages 25 to 29 years Comparison
Immigrants from Ethiopia
Bulgarians
6.0%
UNEMPLOYMENT AMONG AGES 25 TO 29 YEARS
99.9/ 100
METRIC RATING
21st/ 347
METRIC RANK
6.1%
UNEMPLOYMENT AMONG AGES 25 TO 29 YEARS
99.7/ 100
METRIC RATING
30th/ 347
METRIC RANK
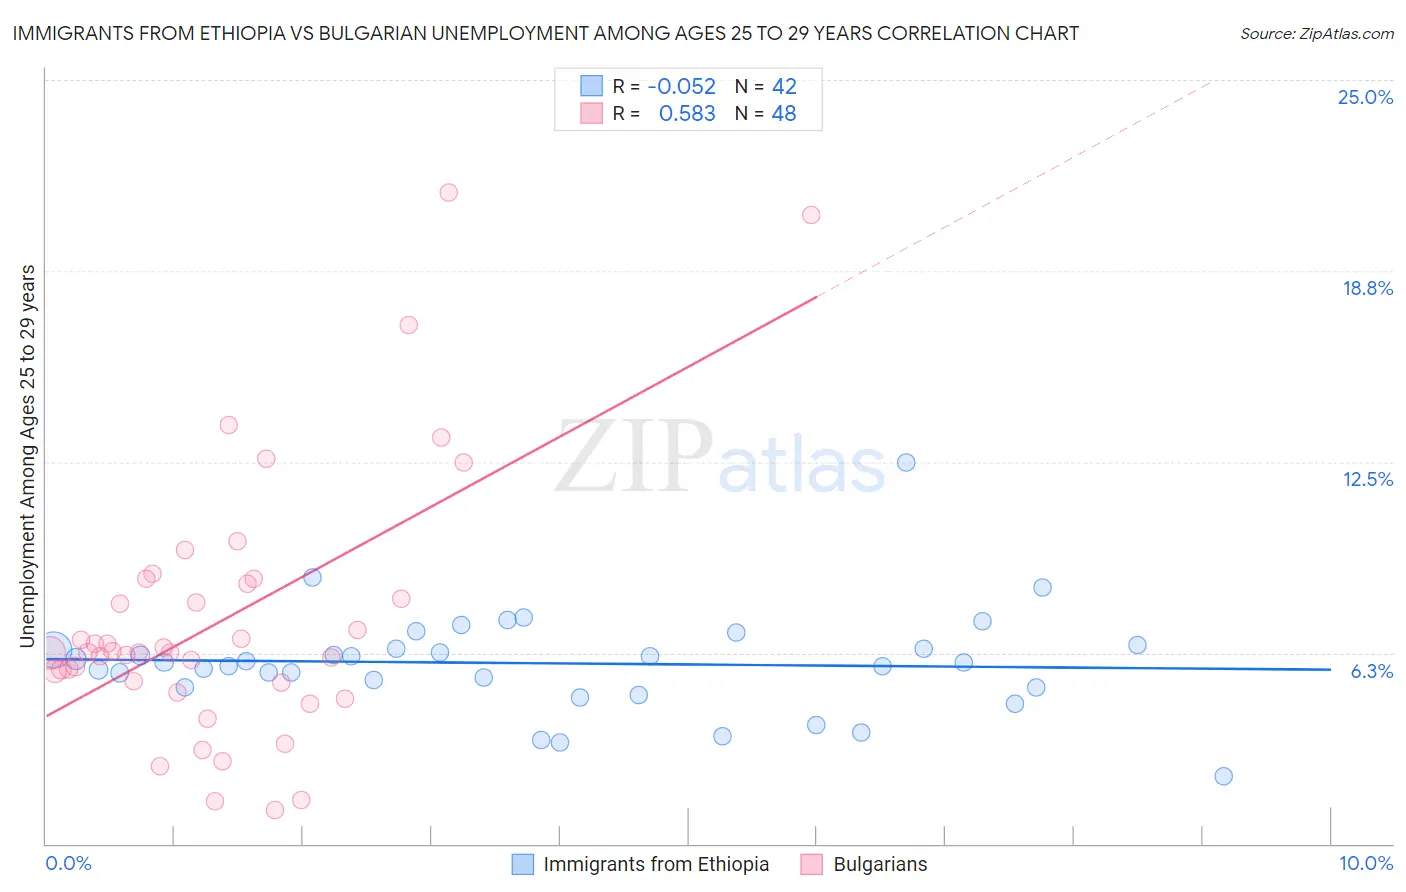
Immigrants from Ethiopia vs Bulgarian Unemployment Among Ages 25 to 29 years Correlation Chart
The statistical analysis conducted on geographies consisting of 206,943,283 people shows a slight negative correlation between the proportion of Immigrants from Ethiopia and unemployment rate among population between the ages 25 and 29 in the United States with a correlation coefficient (R) of -0.052 and weighted average of 6.0%. Similarly, the statistical analysis conducted on geographies consisting of 199,451,954 people shows a substantial positive correlation between the proportion of Bulgarians and unemployment rate among population between the ages 25 and 29 in the United States with a correlation coefficient (R) of 0.583 and weighted average of 6.1%, a difference of 1.6%.
Unemployment Among Ages 25 to 29 years Correlation Summary
| Measurement | Immigrants from Ethiopia | Bulgarian |
| Minimum | 2.2% | 1.1% |
| Maximum | 12.5% | 21.3% |
| Range | 10.3% | 20.2% |
| Mean | 5.9% | 7.3% |
| Median | 5.9% | 6.3% |
| Interquartile 25% (IQ1) | 5.1% | 5.3% |
| Interquartile 75% (IQ3) | 6.4% | 8.6% |
| Interquartile Range (IQR) | 1.3% | 3.3% |
| Standard Deviation (Sample) | 1.7% | 4.3% |
| Standard Deviation (Population) | 1.7% | 4.2% |
Demographics Similar to Immigrants from Ethiopia and Bulgarians by Unemployment Among Ages 25 to 29 years
In terms of unemployment among ages 25 to 29 years, the demographic groups most similar to Immigrants from Ethiopia are Immigrants from Japan (6.0%, a difference of 0.27%), Immigrants from Venezuela (6.0%, a difference of 0.33%), Immigrants from Eritrea (5.9%, a difference of 0.34%), Norwegian (6.0%, a difference of 0.38%), and Thai (5.9%, a difference of 0.53%). Similarly, the demographic groups most similar to Bulgarians are Filipino (6.1%, a difference of 0.090%), Immigrants from South Central Asia (6.1%, a difference of 0.11%), Danish (6.0%, a difference of 0.29%), Immigrants from Zaire (6.0%, a difference of 0.34%), and Chinese (6.1%, a difference of 0.44%).
| Demographics | Rating | Rank | Unemployment Among Ages 25 to 29 years |
| Cubans | 99.9 /100 | #15 | Exceptional 5.9% |
| Immigrants | Bulgaria | 99.9 /100 | #16 | Exceptional 5.9% |
| Bolivians | 99.9 /100 | #17 | Exceptional 5.9% |
| Immigrants | Singapore | 99.9 /100 | #18 | Exceptional 5.9% |
| Thais | 99.9 /100 | #19 | Exceptional 5.9% |
| Immigrants | Eritrea | 99.9 /100 | #20 | Exceptional 5.9% |
| Immigrants | Ethiopia | 99.9 /100 | #21 | Exceptional 6.0% |
| Immigrants | Japan | 99.9 /100 | #22 | Exceptional 6.0% |
| Immigrants | Venezuela | 99.8 /100 | #23 | Exceptional 6.0% |
| Norwegians | 99.8 /100 | #24 | Exceptional 6.0% |
| New Zealanders | 99.8 /100 | #25 | Exceptional 6.0% |
| Immigrants | Eastern Africa | 99.8 /100 | #26 | Exceptional 6.0% |
| Immigrants | Zaire | 99.7 /100 | #27 | Exceptional 6.0% |
| Danes | 99.7 /100 | #28 | Exceptional 6.0% |
| Immigrants | South Central Asia | 99.7 /100 | #29 | Exceptional 6.1% |
| Bulgarians | 99.7 /100 | #30 | Exceptional 6.1% |
| Filipinos | 99.7 /100 | #31 | Exceptional 6.1% |
| Chinese | 99.6 /100 | #32 | Exceptional 6.1% |
| Yugoslavians | 99.6 /100 | #33 | Exceptional 6.1% |
| Immigrants | Morocco | 99.5 /100 | #34 | Exceptional 6.1% |
| Immigrants | Zimbabwe | 99.5 /100 | #35 | Exceptional 6.1% |