Immigrants from Eritrea vs Immigrants from Morocco Family Households
COMPARE
Immigrants from Eritrea
Immigrants from Morocco
Family Households
Family Households Comparison
Immigrants from Eritrea
Immigrants from Morocco
60.8%
FAMILY HOUSEHOLDS
0.0/ 100
METRIC RATING
338th/ 347
METRIC RANK
62.0%
FAMILY HOUSEHOLDS
0.0/ 100
METRIC RATING
311th/ 347
METRIC RANK
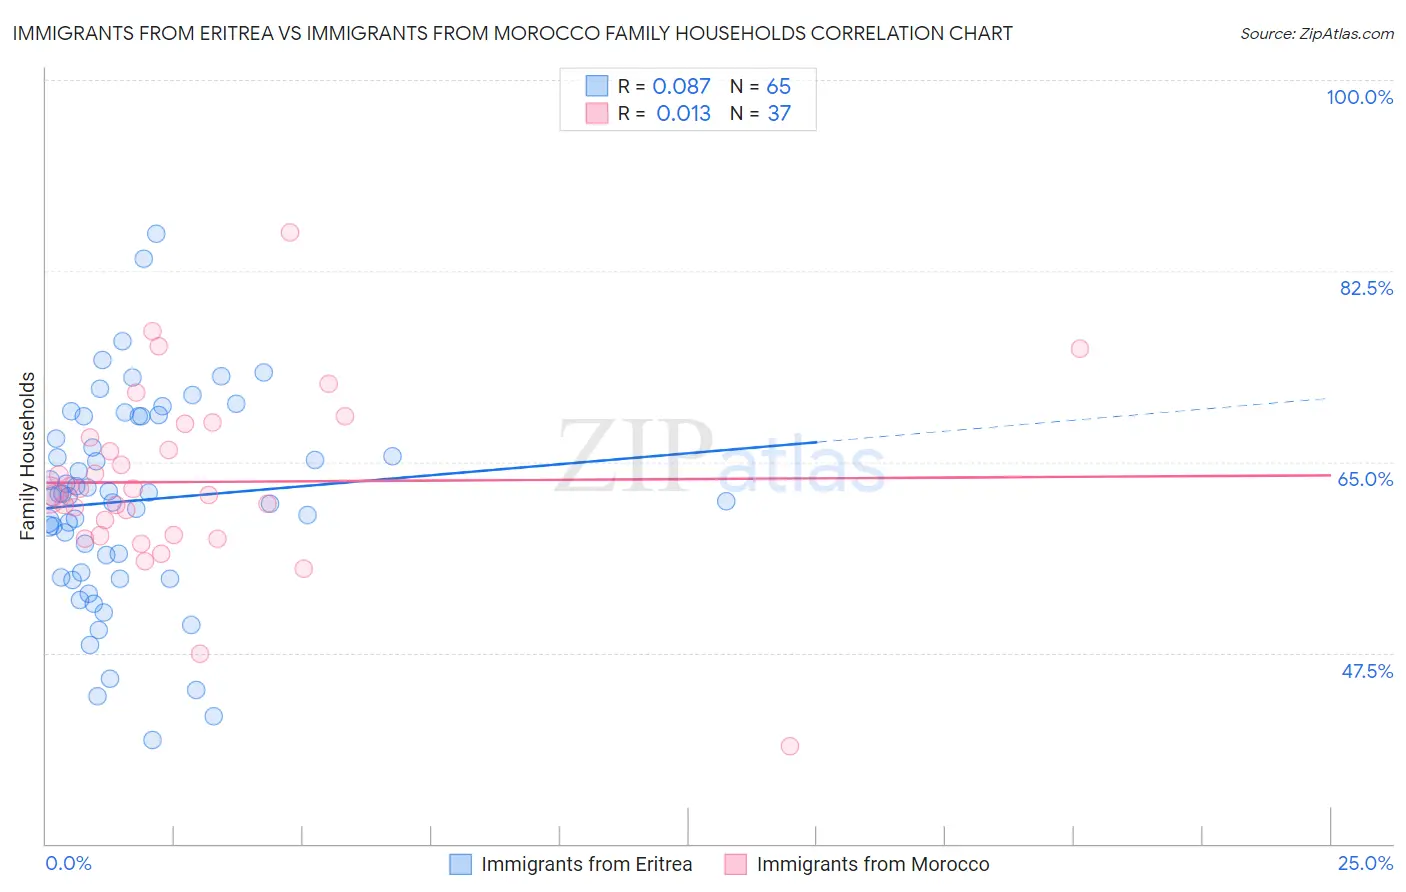
Immigrants from Eritrea vs Immigrants from Morocco Family Households Correlation Chart
The statistical analysis conducted on geographies consisting of 104,847,164 people shows a slight positive correlation between the proportion of Immigrants from Eritrea and percentage of family households in the United States with a correlation coefficient (R) of 0.087 and weighted average of 60.8%. Similarly, the statistical analysis conducted on geographies consisting of 178,909,930 people shows no correlation between the proportion of Immigrants from Morocco and percentage of family households in the United States with a correlation coefficient (R) of 0.013 and weighted average of 62.0%, a difference of 1.9%.
Family Households Correlation Summary
| Measurement | Immigrants from Eritrea | Immigrants from Morocco |
| Minimum | 39.5% | 38.9% |
| Maximum | 85.9% | 86.0% |
| Range | 46.3% | 47.1% |
| Mean | 61.4% | 63.2% |
| Median | 61.9% | 62.0% |
| Interquartile 25% (IQ1) | 54.6% | 58.2% |
| Interquartile 75% (IQ3) | 69.2% | 67.9% |
| Interquartile Range (IQR) | 14.6% | 9.6% |
| Standard Deviation (Sample) | 9.4% | 8.3% |
| Standard Deviation (Population) | 9.3% | 8.2% |
Similar Demographics by Family Households
Demographics Similar to Immigrants from Eritrea by Family Households
In terms of family households, the demographic groups most similar to Immigrants from Eritrea are German Russian (60.9%, a difference of 0.14%), Soviet Union (60.9%, a difference of 0.14%), Immigrants from Saudi Arabia (60.7%, a difference of 0.20%), Carpatho Rusyn (61.1%, a difference of 0.42%), and Immigrants from Eastern Africa (61.1%, a difference of 0.54%).
| Demographics | Rating | Rank | Family Households |
| Immigrants | France | 0.0 /100 | #331 | Tragic 61.3% |
| Ethiopians | 0.0 /100 | #332 | Tragic 61.2% |
| Immigrants | Ethiopia | 0.0 /100 | #333 | Tragic 61.2% |
| Immigrants | Eastern Africa | 0.0 /100 | #334 | Tragic 61.1% |
| Carpatho Rusyns | 0.0 /100 | #335 | Tragic 61.1% |
| German Russians | 0.0 /100 | #336 | Tragic 60.9% |
| Soviet Union | 0.0 /100 | #337 | Tragic 60.9% |
| Immigrants | Eritrea | 0.0 /100 | #338 | Tragic 60.8% |
| Immigrants | Saudi Arabia | 0.0 /100 | #339 | Tragic 60.7% |
| Immigrants | Sudan | 0.0 /100 | #340 | Tragic 60.2% |
| Immigrants | Senegal | 0.0 /100 | #341 | Tragic 60.1% |
| Sudanese | 0.0 /100 | #342 | Tragic 60.0% |
| Senegalese | 0.0 /100 | #343 | Tragic 59.8% |
| Immigrants | Congo | 0.0 /100 | #344 | Tragic 59.2% |
| Immigrants | Zaire | 0.0 /100 | #345 | Tragic 59.2% |
Demographics Similar to Immigrants from Morocco by Family Households
In terms of family households, the demographic groups most similar to Immigrants from Morocco are Immigrants from Liberia (62.0%, a difference of 0.030%), Immigrants from Latvia (62.0%, a difference of 0.050%), Liberian (62.0%, a difference of 0.050%), Subsaharan African (62.1%, a difference of 0.070%), and Immigrants from Cabo Verde (61.9%, a difference of 0.10%).
| Demographics | Rating | Rank | Family Households |
| Iroquois | 0.0 /100 | #304 | Tragic 62.2% |
| Bermudans | 0.0 /100 | #305 | Tragic 62.2% |
| Africans | 0.0 /100 | #306 | Tragic 62.1% |
| Immigrants | Norway | 0.0 /100 | #307 | Tragic 62.1% |
| Chippewa | 0.0 /100 | #308 | Tragic 62.1% |
| Sub-Saharan Africans | 0.0 /100 | #309 | Tragic 62.1% |
| Immigrants | Liberia | 0.0 /100 | #310 | Tragic 62.0% |
| Immigrants | Morocco | 0.0 /100 | #311 | Tragic 62.0% |
| Immigrants | Latvia | 0.0 /100 | #312 | Tragic 62.0% |
| Liberians | 0.0 /100 | #313 | Tragic 62.0% |
| Immigrants | Cabo Verde | 0.0 /100 | #314 | Tragic 61.9% |
| Moroccans | 0.0 /100 | #315 | Tragic 61.9% |
| Immigrants | Middle Africa | 0.0 /100 | #316 | Tragic 61.9% |
| Immigrants | Bosnia and Herzegovina | 0.0 /100 | #317 | Tragic 61.9% |
| Alaskan Athabascans | 0.0 /100 | #318 | Tragic 61.8% |