Immigrants from Eritrea vs Hawaiian Single Father Households
COMPARE
Immigrants from Eritrea
Hawaiian
Single Father Households
Single Father Households Comparison
Immigrants from Eritrea
Hawaiians
2.5%
SINGLE FATHER HOUSEHOLDS
2.0/ 100
METRIC RATING
252nd/ 347
METRIC RANK
2.7%
SINGLE FATHER HOUSEHOLDS
0.1/ 100
METRIC RATING
284th/ 347
METRIC RANK
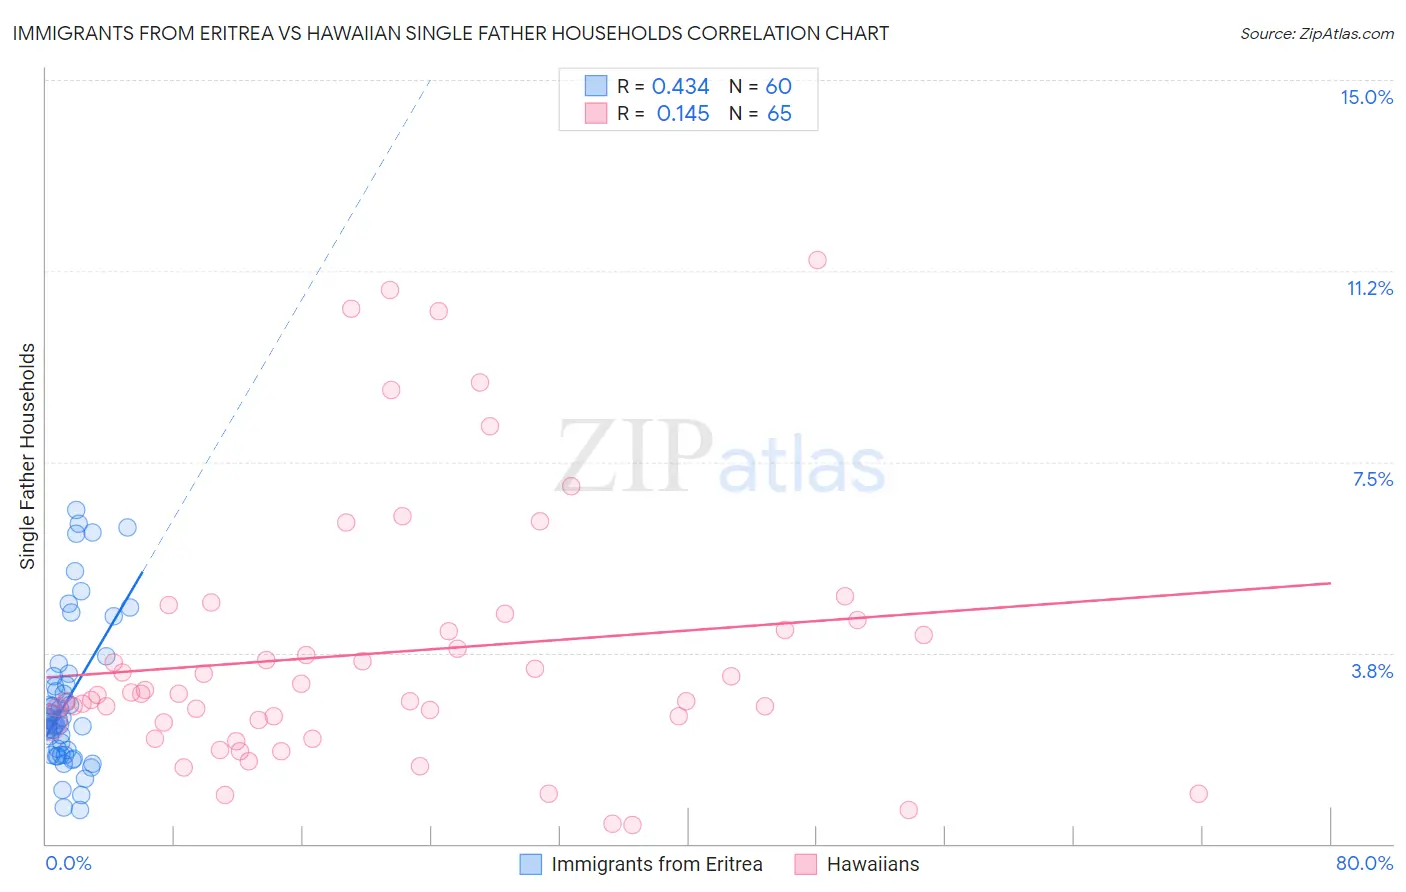
Immigrants from Eritrea vs Hawaiian Single Father Households Correlation Chart
The statistical analysis conducted on geographies consisting of 104,791,168 people shows a moderate positive correlation between the proportion of Immigrants from Eritrea and percentage of single father households in the United States with a correlation coefficient (R) of 0.434 and weighted average of 2.5%. Similarly, the statistical analysis conducted on geographies consisting of 325,328,824 people shows a poor positive correlation between the proportion of Hawaiians and percentage of single father households in the United States with a correlation coefficient (R) of 0.145 and weighted average of 2.7%, a difference of 6.1%.
Single Father Households Correlation Summary
| Measurement | Immigrants from Eritrea | Hawaiian |
| Minimum | 0.67% | 0.37% |
| Maximum | 6.6% | 11.5% |
| Range | 5.9% | 11.1% |
| Mean | 2.8% | 3.7% |
| Median | 2.4% | 2.9% |
| Interquartile 25% (IQ1) | 1.8% | 2.4% |
| Interquartile 75% (IQ3) | 3.2% | 4.3% |
| Interquartile Range (IQR) | 1.4% | 1.9% |
| Standard Deviation (Sample) | 1.4% | 2.6% |
| Standard Deviation (Population) | 1.4% | 2.6% |
Similar Demographics by Single Father Households
Demographics Similar to Immigrants from Eritrea by Single Father Households
In terms of single father households, the demographic groups most similar to Immigrants from Eritrea are Liberian (2.5%, a difference of 0.020%), Immigrants from Somalia (2.5%, a difference of 0.070%), Immigrants from Thailand (2.5%, a difference of 0.10%), Somali (2.5%, a difference of 0.11%), and Immigrants from Cameroon (2.5%, a difference of 0.28%).
| Demographics | Rating | Rank | Single Father Households |
| Basques | 2.5 /100 | #245 | Tragic 2.5% |
| Native Hawaiians | 2.5 /100 | #246 | Tragic 2.5% |
| Delaware | 2.5 /100 | #247 | Tragic 2.5% |
| Bahamians | 2.4 /100 | #248 | Tragic 2.5% |
| Immigrants | Cameroon | 2.3 /100 | #249 | Tragic 2.5% |
| Somalis | 2.1 /100 | #250 | Tragic 2.5% |
| Liberians | 2.0 /100 | #251 | Tragic 2.5% |
| Immigrants | Eritrea | 2.0 /100 | #252 | Tragic 2.5% |
| Immigrants | Somalia | 1.9 /100 | #253 | Tragic 2.5% |
| Immigrants | Thailand | 1.8 /100 | #254 | Tragic 2.5% |
| Tongans | 1.5 /100 | #255 | Tragic 2.5% |
| Potawatomi | 1.4 /100 | #256 | Tragic 2.5% |
| Immigrants | Congo | 1.2 /100 | #257 | Tragic 2.5% |
| Spanish | 1.1 /100 | #258 | Tragic 2.5% |
| Comanche | 1.0 /100 | #259 | Tragic 2.5% |
Demographics Similar to Hawaiians by Single Father Households
In terms of single father households, the demographic groups most similar to Hawaiians are Immigrants from Nicaragua (2.7%, a difference of 0.050%), Ottawa (2.7%, a difference of 0.090%), Immigrants from Cuba (2.7%, a difference of 0.10%), Central American Indian (2.7%, a difference of 0.25%), and Immigrants from Cambodia (2.7%, a difference of 0.50%).
| Demographics | Rating | Rank | Single Father Households |
| Shoshone | 0.1 /100 | #277 | Tragic 2.6% |
| Cherokee | 0.1 /100 | #278 | Tragic 2.6% |
| Samoans | 0.1 /100 | #279 | Tragic 2.6% |
| Immigrants | Portugal | 0.1 /100 | #280 | Tragic 2.6% |
| Nicaraguans | 0.1 /100 | #281 | Tragic 2.6% |
| Dutch West Indians | 0.1 /100 | #282 | Tragic 2.6% |
| Immigrants | Nicaragua | 0.1 /100 | #283 | Tragic 2.7% |
| Hawaiians | 0.1 /100 | #284 | Tragic 2.7% |
| Ottawa | 0.1 /100 | #285 | Tragic 2.7% |
| Immigrants | Cuba | 0.1 /100 | #286 | Tragic 2.7% |
| Central American Indians | 0.0 /100 | #287 | Tragic 2.7% |
| Immigrants | Cambodia | 0.0 /100 | #288 | Tragic 2.7% |
| Tlingit-Haida | 0.0 /100 | #289 | Tragic 2.7% |
| Puget Sound Salish | 0.0 /100 | #290 | Tragic 2.7% |
| Blackfeet | 0.0 /100 | #291 | Tragic 2.7% |