Puget Sound Salish vs Hawaiian Single Father Households
COMPARE
Puget Sound Salish
Hawaiian
Single Father Households
Single Father Households Comparison
Puget Sound Salish
Hawaiians
2.7%
SINGLE FATHER HOUSEHOLDS
0.0/ 100
METRIC RATING
290th/ 347
METRIC RANK
2.7%
SINGLE FATHER HOUSEHOLDS
0.1/ 100
METRIC RATING
284th/ 347
METRIC RANK
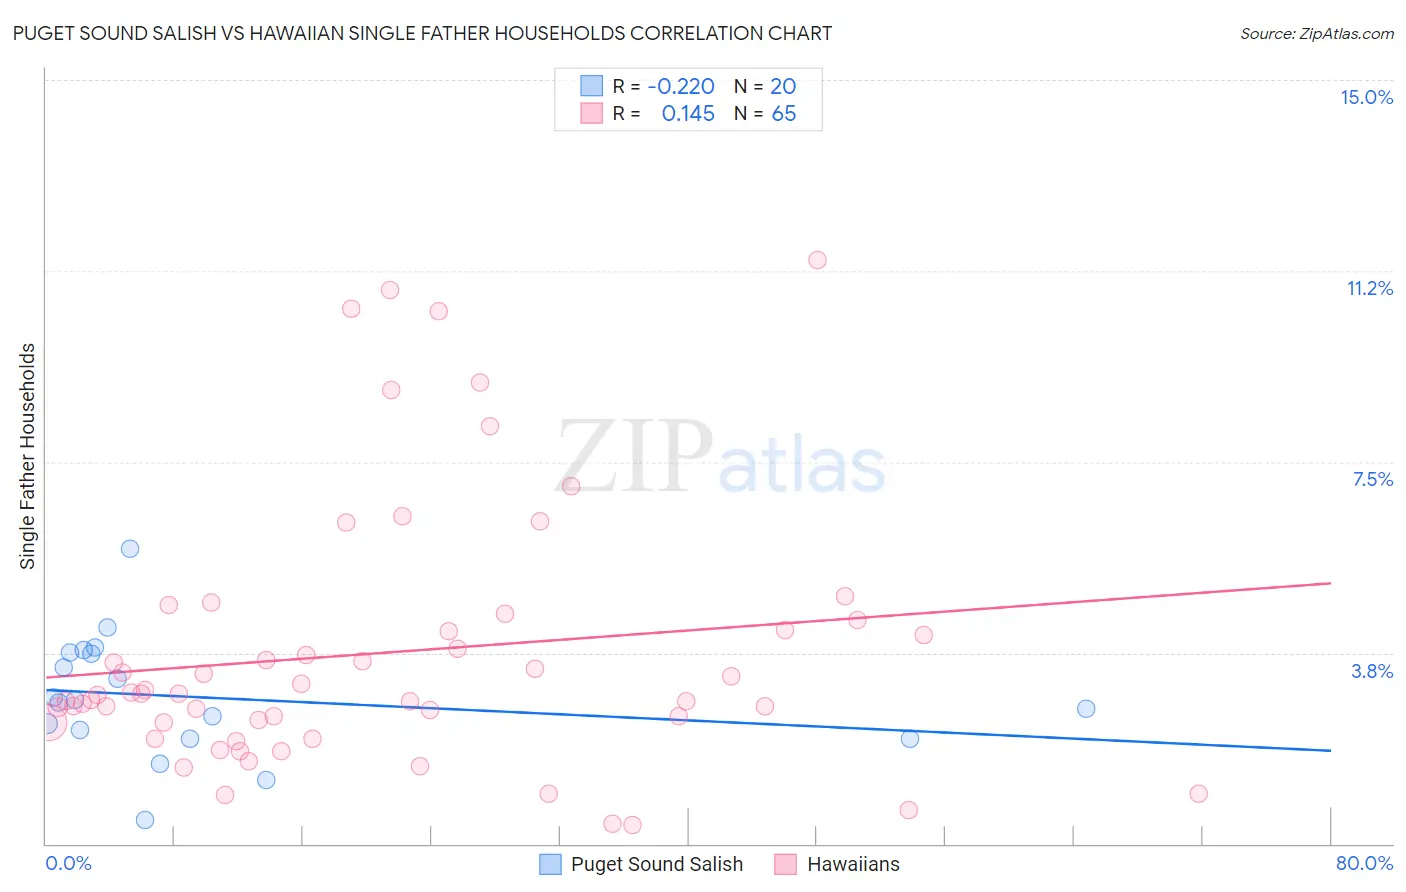
Puget Sound Salish vs Hawaiian Single Father Households Correlation Chart
The statistical analysis conducted on geographies consisting of 46,042,522 people shows a weak negative correlation between the proportion of Puget Sound Salish and percentage of single father households in the United States with a correlation coefficient (R) of -0.220 and weighted average of 2.7%. Similarly, the statistical analysis conducted on geographies consisting of 325,328,824 people shows a poor positive correlation between the proportion of Hawaiians and percentage of single father households in the United States with a correlation coefficient (R) of 0.145 and weighted average of 2.7%, a difference of 1.0%.
Single Father Households Correlation Summary
| Measurement | Puget Sound Salish | Hawaiian |
| Minimum | 0.46% | 0.37% |
| Maximum | 5.8% | 11.5% |
| Range | 5.3% | 11.1% |
| Mean | 2.9% | 3.7% |
| Median | 2.8% | 2.9% |
| Interquartile 25% (IQ1) | 2.2% | 2.4% |
| Interquartile 75% (IQ3) | 3.7% | 4.3% |
| Interquartile Range (IQR) | 1.6% | 1.9% |
| Standard Deviation (Sample) | 1.2% | 2.6% |
| Standard Deviation (Population) | 1.2% | 2.6% |
Demographics Similar to Puget Sound Salish and Hawaiians by Single Father Households
In terms of single father households, the demographic groups most similar to Puget Sound Salish are Tlingit-Haida (2.7%, a difference of 0.45%), Immigrants from Cambodia (2.7%, a difference of 0.52%), Blackfeet (2.7%, a difference of 0.56%), Central American Indian (2.7%, a difference of 0.77%), and Immigrants from Cuba (2.7%, a difference of 0.92%). Similarly, the demographic groups most similar to Hawaiians are Immigrants from Nicaragua (2.7%, a difference of 0.050%), Ottawa (2.7%, a difference of 0.090%), Immigrants from Cuba (2.7%, a difference of 0.10%), Central American Indian (2.7%, a difference of 0.25%), and Immigrants from Cambodia (2.7%, a difference of 0.50%).
| Demographics | Rating | Rank | Single Father Households |
| Shoshone | 0.1 /100 | #277 | Tragic 2.6% |
| Cherokee | 0.1 /100 | #278 | Tragic 2.6% |
| Samoans | 0.1 /100 | #279 | Tragic 2.6% |
| Immigrants | Portugal | 0.1 /100 | #280 | Tragic 2.6% |
| Nicaraguans | 0.1 /100 | #281 | Tragic 2.6% |
| Dutch West Indians | 0.1 /100 | #282 | Tragic 2.6% |
| Immigrants | Nicaragua | 0.1 /100 | #283 | Tragic 2.7% |
| Hawaiians | 0.1 /100 | #284 | Tragic 2.7% |
| Ottawa | 0.1 /100 | #285 | Tragic 2.7% |
| Immigrants | Cuba | 0.1 /100 | #286 | Tragic 2.7% |
| Central American Indians | 0.0 /100 | #287 | Tragic 2.7% |
| Immigrants | Cambodia | 0.0 /100 | #288 | Tragic 2.7% |
| Tlingit-Haida | 0.0 /100 | #289 | Tragic 2.7% |
| Puget Sound Salish | 0.0 /100 | #290 | Tragic 2.7% |
| Blackfeet | 0.0 /100 | #291 | Tragic 2.7% |
| Choctaw | 0.0 /100 | #292 | Tragic 2.7% |
| Immigrants | Fiji | 0.0 /100 | #293 | Tragic 2.7% |
| Malaysians | 0.0 /100 | #294 | Tragic 2.7% |
| Chickasaw | 0.0 /100 | #295 | Tragic 2.8% |
| Japanese | 0.0 /100 | #296 | Tragic 2.8% |
| Hondurans | 0.0 /100 | #297 | Tragic 2.8% |