Immigrants from Egypt vs Austrian Unemployment Among Women with Children Under 6 years
COMPARE
Immigrants from Egypt
Austrian
Unemployment Among Women with Children Under 6 years
Unemployment Among Women with Children Under 6 years Comparison
Immigrants from Egypt
Austrians
7.2%
UNEMPLOYMENT AMONG WOMEN WITH CHILDREN UNDER 6 YEARS
97.2/ 100
METRIC RATING
104th/ 347
METRIC RANK
7.7%
UNEMPLOYMENT AMONG WOMEN WITH CHILDREN UNDER 6 YEARS
46.0/ 100
METRIC RATING
177th/ 347
METRIC RANK
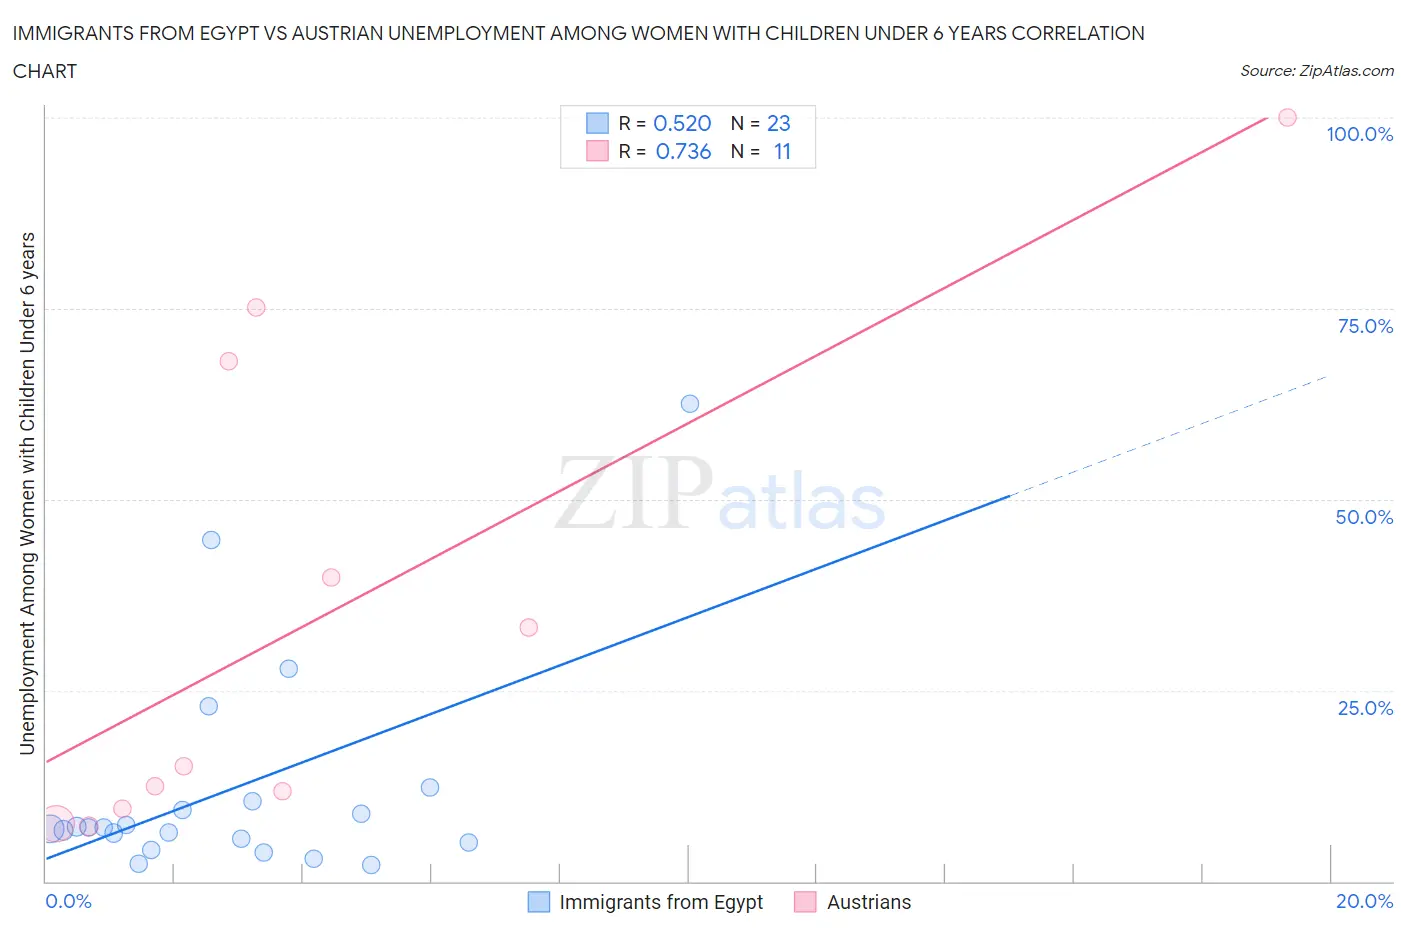
Immigrants from Egypt vs Austrian Unemployment Among Women with Children Under 6 years Correlation Chart
The statistical analysis conducted on geographies consisting of 202,245,410 people shows a substantial positive correlation between the proportion of Immigrants from Egypt and unemployment rate among women with children under the age of 6 in the United States with a correlation coefficient (R) of 0.520 and weighted average of 7.2%. Similarly, the statistical analysis conducted on geographies consisting of 322,238,439 people shows a strong positive correlation between the proportion of Austrians and unemployment rate among women with children under the age of 6 in the United States with a correlation coefficient (R) of 0.736 and weighted average of 7.7%, a difference of 6.5%.
Unemployment Among Women with Children Under 6 years Correlation Summary
| Measurement | Immigrants from Egypt | Austrian |
| Minimum | 2.2% | 7.2% |
| Maximum | 62.5% | 100.0% |
| Range | 60.3% | 92.8% |
| Mean | 12.2% | 34.5% |
| Median | 7.0% | 15.0% |
| Interquartile 25% (IQ1) | 5.1% | 9.5% |
| Interquartile 75% (IQ3) | 10.5% | 68.1% |
| Interquartile Range (IQR) | 5.4% | 58.6% |
| Standard Deviation (Sample) | 14.6% | 32.5% |
| Standard Deviation (Population) | 14.3% | 31.0% |
Similar Demographics by Unemployment Among Women with Children Under 6 years
Demographics Similar to Immigrants from Egypt by Unemployment Among Women with Children Under 6 years
In terms of unemployment among women with children under 6 years, the demographic groups most similar to Immigrants from Egypt are Venezuelan (7.2%, a difference of 0.010%), Immigrants from Pakistan (7.2%, a difference of 0.030%), Immigrants from Kazakhstan (7.2%, a difference of 0.040%), Immigrants from Nicaragua (7.2%, a difference of 0.080%), and Immigrants from Saudi Arabia (7.2%, a difference of 0.080%).
| Demographics | Rating | Rank | Unemployment Among Women with Children Under 6 years |
| Immigrants | South Eastern Asia | 97.6 /100 | #97 | Exceptional 7.2% |
| Russians | 97.5 /100 | #98 | Exceptional 7.2% |
| Immigrants | Europe | 97.5 /100 | #99 | Exceptional 7.2% |
| Immigrants | Northern Europe | 97.4 /100 | #100 | Exceptional 7.2% |
| Chileans | 97.4 /100 | #101 | Exceptional 7.2% |
| Immigrants | Nicaragua | 97.3 /100 | #102 | Exceptional 7.2% |
| Immigrants | Saudi Arabia | 97.3 /100 | #103 | Exceptional 7.2% |
| Immigrants | Egypt | 97.2 /100 | #104 | Exceptional 7.2% |
| Venezuelans | 97.2 /100 | #105 | Exceptional 7.2% |
| Immigrants | Pakistan | 97.2 /100 | #106 | Exceptional 7.2% |
| Immigrants | Kazakhstan | 97.1 /100 | #107 | Exceptional 7.2% |
| Eastern Europeans | 96.9 /100 | #108 | Exceptional 7.2% |
| Australians | 96.9 /100 | #109 | Exceptional 7.2% |
| Palestinians | 96.8 /100 | #110 | Exceptional 7.2% |
| Norwegians | 96.7 /100 | #111 | Exceptional 7.2% |
Demographics Similar to Austrians by Unemployment Among Women with Children Under 6 years
In terms of unemployment among women with children under 6 years, the demographic groups most similar to Austrians are Immigrants from England (7.7%, a difference of 0.040%), Immigrants from Western Europe (7.7%, a difference of 0.070%), Immigrants from Uruguay (7.7%, a difference of 0.10%), Puget Sound Salish (7.7%, a difference of 0.12%), and Brazilian (7.7%, a difference of 0.14%).
| Demographics | Rating | Rank | Unemployment Among Women with Children Under 6 years |
| Czechs | 59.8 /100 | #170 | Average 7.6% |
| Immigrants | Grenada | 59.0 /100 | #171 | Average 7.6% |
| Immigrants | North America | 57.7 /100 | #172 | Average 7.6% |
| Cree | 51.6 /100 | #173 | Average 7.6% |
| Immigrants | Laos | 50.0 /100 | #174 | Average 7.6% |
| Panamanians | 49.6 /100 | #175 | Average 7.6% |
| Puget Sound Salish | 47.7 /100 | #176 | Average 7.7% |
| Austrians | 46.0 /100 | #177 | Average 7.7% |
| Immigrants | England | 45.4 /100 | #178 | Average 7.7% |
| Immigrants | Western Europe | 44.9 /100 | #179 | Average 7.7% |
| Immigrants | Uruguay | 44.5 /100 | #180 | Average 7.7% |
| Brazilians | 43.9 /100 | #181 | Average 7.7% |
| Nepalese | 43.5 /100 | #182 | Average 7.7% |
| Sierra Leoneans | 42.9 /100 | #183 | Average 7.7% |
| Indonesians | 40.5 /100 | #184 | Average 7.7% |