Immigrants from Eastern Asia vs Kiowa Divorced or Separated
COMPARE
Immigrants from Eastern Asia
Kiowa
Divorced or Separated
Divorced or Separated Comparison
Immigrants from Eastern Asia
Kiowa
10.2%
DIVORCED OR SEPARATED
100.0/ 100
METRIC RATING
8th/ 347
METRIC RANK
14.5%
DIVORCED OR SEPARATED
0.0/ 100
METRIC RATING
345th/ 347
METRIC RANK
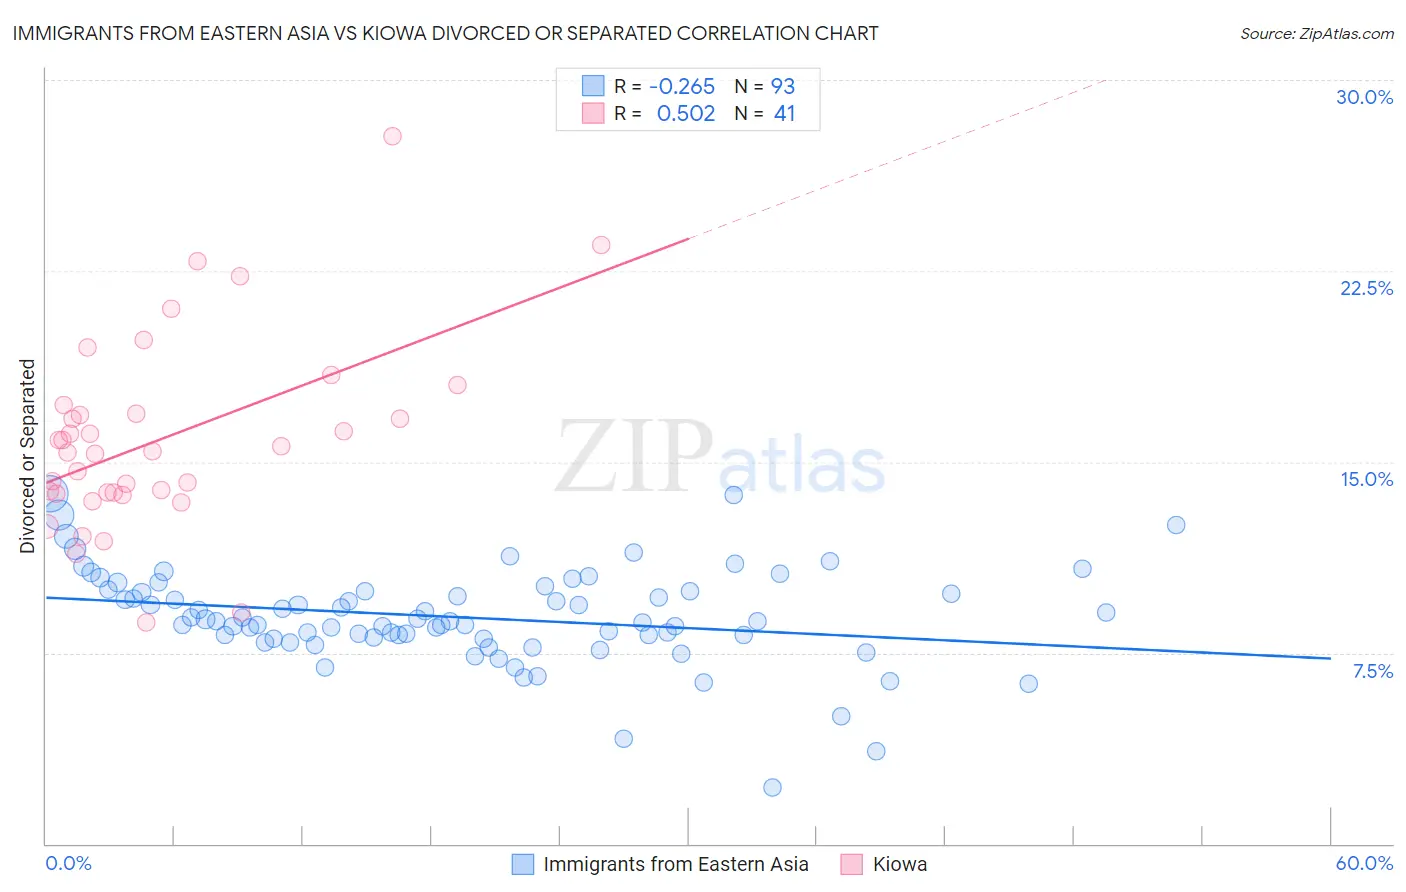
Immigrants from Eastern Asia vs Kiowa Divorced or Separated Correlation Chart
The statistical analysis conducted on geographies consisting of 499,533,404 people shows a weak negative correlation between the proportion of Immigrants from Eastern Asia and percentage of population currently divorced or separated in the United States with a correlation coefficient (R) of -0.265 and weighted average of 10.2%. Similarly, the statistical analysis conducted on geographies consisting of 56,101,840 people shows a substantial positive correlation between the proportion of Kiowa and percentage of population currently divorced or separated in the United States with a correlation coefficient (R) of 0.502 and weighted average of 14.5%, a difference of 41.8%.
Divorced or Separated Correlation Summary
| Measurement | Immigrants from Eastern Asia | Kiowa |
| Minimum | 2.2% | 8.7% |
| Maximum | 13.7% | 27.8% |
| Range | 11.5% | 19.1% |
| Mean | 8.9% | 15.9% |
| Median | 8.7% | 15.4% |
| Interquartile 25% (IQ1) | 8.1% | 13.8% |
| Interquartile 75% (IQ3) | 9.9% | 17.1% |
| Interquartile Range (IQR) | 1.8% | 3.3% |
| Standard Deviation (Sample) | 1.9% | 3.8% |
| Standard Deviation (Population) | 1.9% | 3.7% |
Similar Demographics by Divorced or Separated
Demographics Similar to Immigrants from Eastern Asia by Divorced or Separated
In terms of divorced or separated, the demographic groups most similar to Immigrants from Eastern Asia are Thai (10.2%, a difference of 0.34%), Indian (Asian) (10.2%, a difference of 0.39%), Yup'ik (10.3%, a difference of 0.44%), Immigrants from Singapore (10.3%, a difference of 0.97%), and Immigrants from India (10.1%, a difference of 1.7%).
| Demographics | Rating | Rank | Divorced or Separated |
| Immigrants | Taiwan | 100.0 /100 | #1 | Exceptional 9.8% |
| Filipinos | 100.0 /100 | #2 | Exceptional 9.9% |
| Immigrants | Hong Kong | 100.0 /100 | #3 | Exceptional 10.0% |
| Immigrants | China | 100.0 /100 | #4 | Exceptional 10.0% |
| Immigrants | India | 100.0 /100 | #5 | Exceptional 10.1% |
| Indians (Asian) | 100.0 /100 | #6 | Exceptional 10.2% |
| Thais | 100.0 /100 | #7 | Exceptional 10.2% |
| Immigrants | Eastern Asia | 100.0 /100 | #8 | Exceptional 10.2% |
| Yup'ik | 100.0 /100 | #9 | Exceptional 10.3% |
| Immigrants | Singapore | 100.0 /100 | #10 | Exceptional 10.3% |
| Immigrants | South Central Asia | 100.0 /100 | #11 | Exceptional 10.4% |
| Okinawans | 100.0 /100 | #12 | Exceptional 10.5% |
| Cypriots | 100.0 /100 | #13 | Exceptional 10.5% |
| Assyrians/Chaldeans/Syriacs | 100.0 /100 | #14 | Exceptional 10.6% |
| Immigrants | Armenia | 100.0 /100 | #15 | Exceptional 10.6% |
Demographics Similar to Kiowa by Divorced or Separated
In terms of divorced or separated, the demographic groups most similar to Kiowa are Cuban (14.5%, a difference of 0.10%), Creek (14.4%, a difference of 0.77%), Seminole (14.3%, a difference of 1.8%), Bahamian (14.2%, a difference of 2.0%), and Arapaho (14.8%, a difference of 2.1%).
| Demographics | Rating | Rank | Divorced or Separated |
| Puerto Ricans | 0.0 /100 | #333 | Tragic 13.9% |
| Immigrants | Bahamas | 0.0 /100 | #334 | Tragic 13.9% |
| Dutch West Indians | 0.0 /100 | #335 | Tragic 14.0% |
| Shoshone | 0.0 /100 | #336 | Tragic 14.0% |
| Crow | 0.0 /100 | #337 | Tragic 14.1% |
| Choctaw | 0.0 /100 | #338 | Tragic 14.1% |
| Colville | 0.0 /100 | #339 | Tragic 14.2% |
| Chickasaw | 0.0 /100 | #340 | Tragic 14.2% |
| Bahamians | 0.0 /100 | #341 | Tragic 14.2% |
| Seminole | 0.0 /100 | #342 | Tragic 14.3% |
| Creek | 0.0 /100 | #343 | Tragic 14.4% |
| Cubans | 0.0 /100 | #344 | Tragic 14.5% |
| Kiowa | 0.0 /100 | #345 | Tragic 14.5% |
| Arapaho | 0.0 /100 | #346 | Tragic 14.8% |
| Immigrants | Cuba | 0.0 /100 | #347 | Tragic 15.2% |