Bermudan vs Kiowa Divorced or Separated
COMPARE
Bermudan
Kiowa
Divorced or Separated
Divorced or Separated Comparison
Bermudans
Kiowa
12.7%
DIVORCED OR SEPARATED
0.3/ 100
METRIC RATING
274th/ 347
METRIC RANK
14.5%
DIVORCED OR SEPARATED
0.0/ 100
METRIC RATING
345th/ 347
METRIC RANK
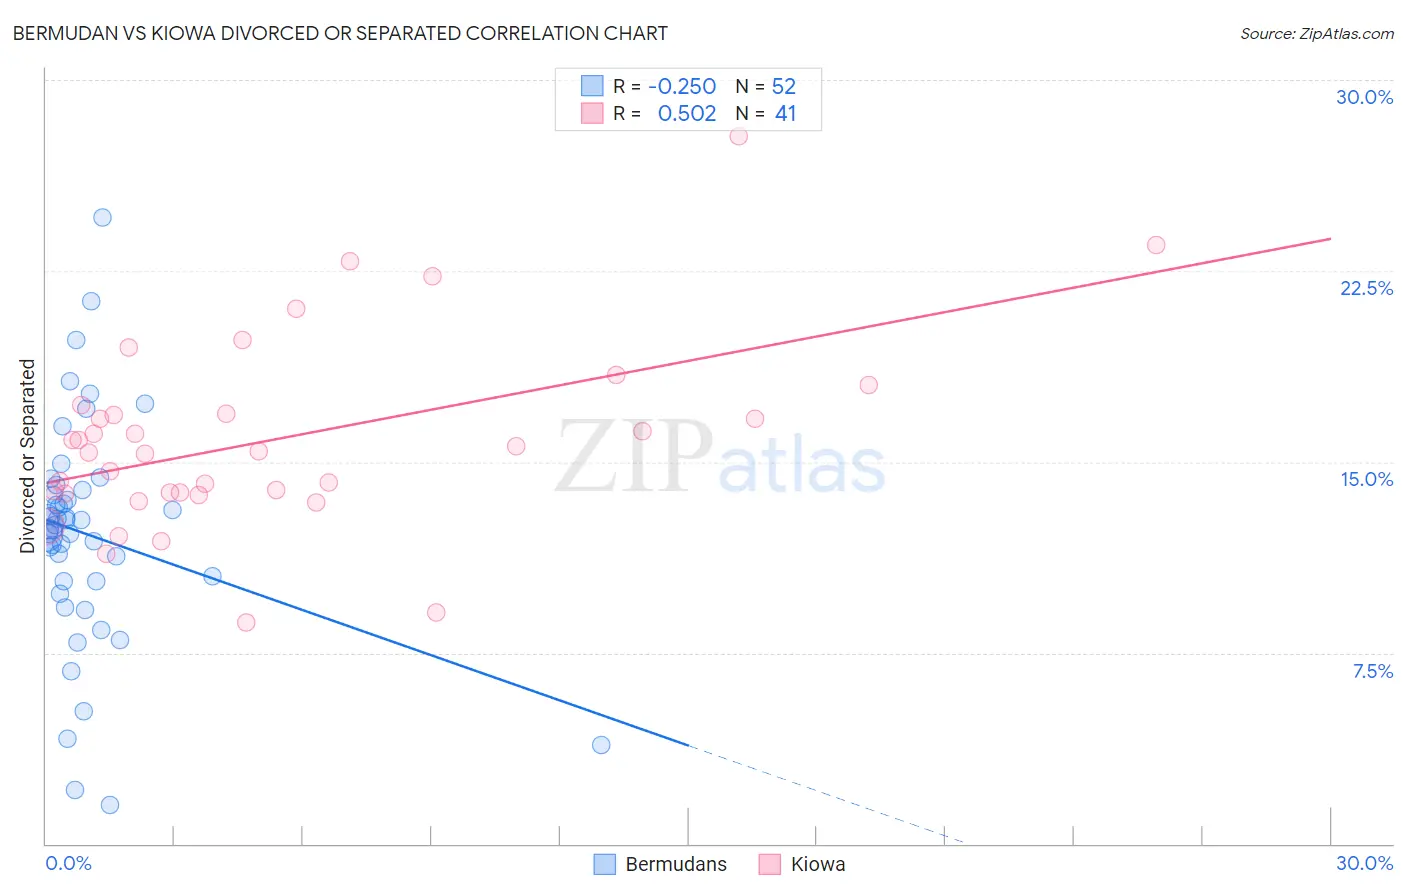
Bermudan vs Kiowa Divorced or Separated Correlation Chart
The statistical analysis conducted on geographies consisting of 55,731,861 people shows a weak negative correlation between the proportion of Bermudans and percentage of population currently divorced or separated in the United States with a correlation coefficient (R) of -0.250 and weighted average of 12.7%. Similarly, the statistical analysis conducted on geographies consisting of 56,101,840 people shows a substantial positive correlation between the proportion of Kiowa and percentage of population currently divorced or separated in the United States with a correlation coefficient (R) of 0.502 and weighted average of 14.5%, a difference of 14.6%.
Divorced or Separated Correlation Summary
| Measurement | Bermudan | Kiowa |
| Minimum | 1.5% | 8.7% |
| Maximum | 24.6% | 27.8% |
| Range | 23.1% | 19.1% |
| Mean | 12.1% | 15.9% |
| Median | 12.4% | 15.4% |
| Interquartile 25% (IQ1) | 10.3% | 13.8% |
| Interquartile 75% (IQ3) | 13.8% | 17.1% |
| Interquartile Range (IQR) | 3.5% | 3.3% |
| Standard Deviation (Sample) | 4.4% | 3.8% |
| Standard Deviation (Population) | 4.3% | 3.7% |
Similar Demographics by Divorced or Separated
Demographics Similar to Bermudans by Divorced or Separated
In terms of divorced or separated, the demographic groups most similar to Bermudans are Immigrants from Micronesia (12.7%, a difference of 0.010%), Central American Indian (12.7%, a difference of 0.020%), Spaniard (12.7%, a difference of 0.090%), Immigrants from Middle Africa (12.7%, a difference of 0.13%), and Dominican (12.7%, a difference of 0.14%).
| Demographics | Rating | Rank | Divorced or Separated |
| Scottish | 0.4 /100 | #267 | Tragic 12.6% |
| Fijians | 0.4 /100 | #268 | Tragic 12.6% |
| Immigrants | Liberia | 0.4 /100 | #269 | Tragic 12.6% |
| Ute | 0.4 /100 | #270 | Tragic 12.6% |
| Panamanians | 0.3 /100 | #271 | Tragic 12.7% |
| Immigrants | Middle Africa | 0.3 /100 | #272 | Tragic 12.7% |
| Immigrants | Micronesia | 0.3 /100 | #273 | Tragic 12.7% |
| Bermudans | 0.3 /100 | #274 | Tragic 12.7% |
| Central American Indians | 0.3 /100 | #275 | Tragic 12.7% |
| Spaniards | 0.2 /100 | #276 | Tragic 12.7% |
| Dominicans | 0.2 /100 | #277 | Tragic 12.7% |
| Lumbee | 0.2 /100 | #278 | Tragic 12.7% |
| Immigrants | Dominican Republic | 0.2 /100 | #279 | Tragic 12.7% |
| Immigrants | Zaire | 0.2 /100 | #280 | Tragic 12.7% |
| Pueblo | 0.2 /100 | #281 | Tragic 12.7% |
Demographics Similar to Kiowa by Divorced or Separated
In terms of divorced or separated, the demographic groups most similar to Kiowa are Cuban (14.5%, a difference of 0.10%), Creek (14.4%, a difference of 0.77%), Seminole (14.3%, a difference of 1.8%), Bahamian (14.2%, a difference of 2.0%), and Arapaho (14.8%, a difference of 2.1%).
| Demographics | Rating | Rank | Divorced or Separated |
| Puerto Ricans | 0.0 /100 | #333 | Tragic 13.9% |
| Immigrants | Bahamas | 0.0 /100 | #334 | Tragic 13.9% |
| Dutch West Indians | 0.0 /100 | #335 | Tragic 14.0% |
| Shoshone | 0.0 /100 | #336 | Tragic 14.0% |
| Crow | 0.0 /100 | #337 | Tragic 14.1% |
| Choctaw | 0.0 /100 | #338 | Tragic 14.1% |
| Colville | 0.0 /100 | #339 | Tragic 14.2% |
| Chickasaw | 0.0 /100 | #340 | Tragic 14.2% |
| Bahamians | 0.0 /100 | #341 | Tragic 14.2% |
| Seminole | 0.0 /100 | #342 | Tragic 14.3% |
| Creek | 0.0 /100 | #343 | Tragic 14.4% |
| Cubans | 0.0 /100 | #344 | Tragic 14.5% |
| Kiowa | 0.0 /100 | #345 | Tragic 14.5% |
| Arapaho | 0.0 /100 | #346 | Tragic 14.8% |
| Immigrants | Cuba | 0.0 /100 | #347 | Tragic 15.2% |