Immigrants from Eastern Asia vs Kiowa Vision Disability
COMPARE
Immigrants from Eastern Asia
Kiowa
Vision Disability
Vision Disability Comparison
Immigrants from Eastern Asia
Kiowa
1.8%
VISION DISABILITY
100.0/ 100
METRIC RATING
13th/ 347
METRIC RANK
3.3%
VISION DISABILITY
0.0/ 100
METRIC RATING
341st/ 347
METRIC RANK
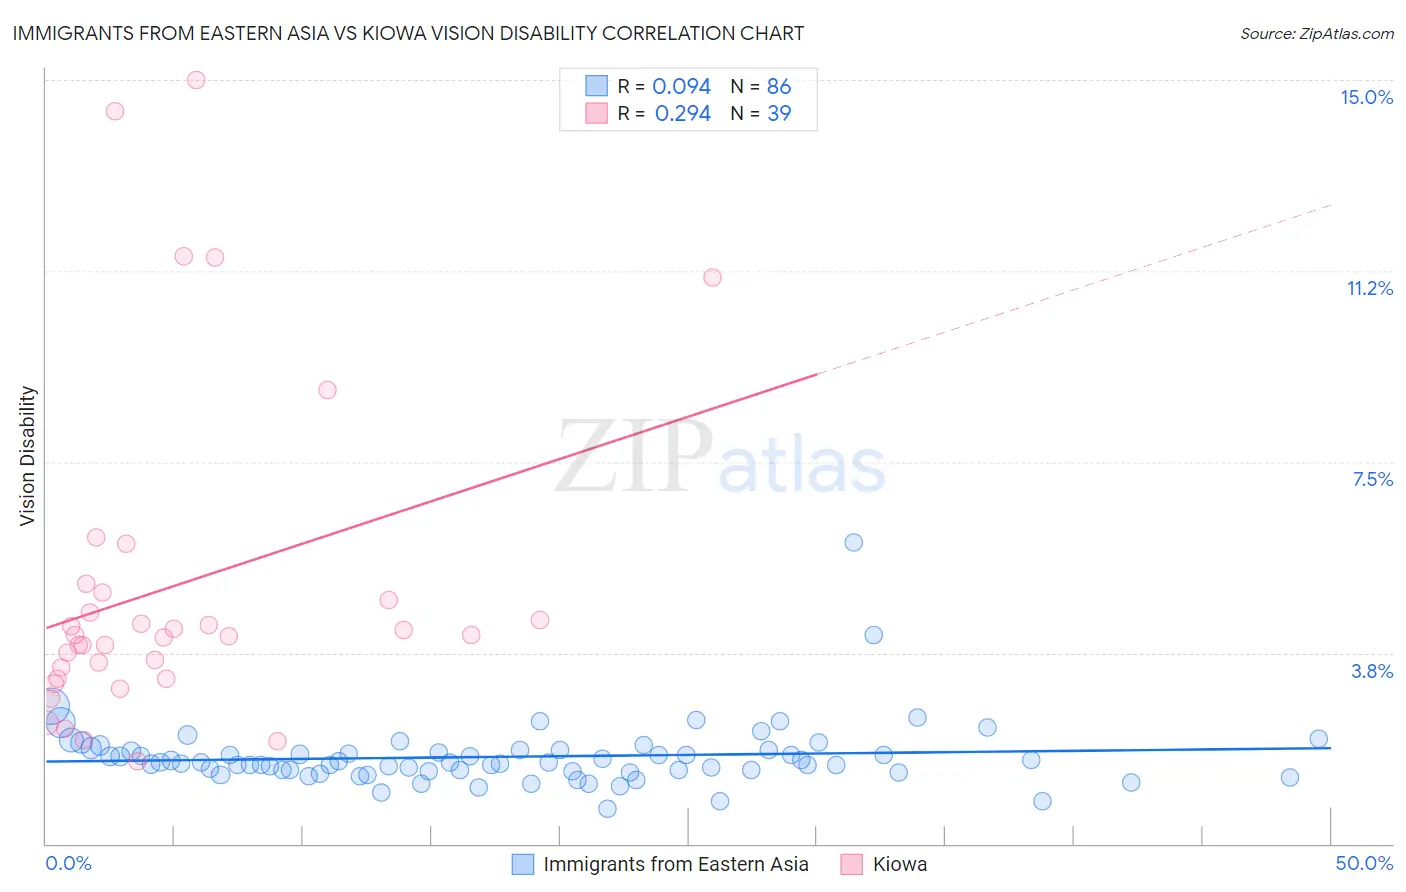
Immigrants from Eastern Asia vs Kiowa Vision Disability Correlation Chart
The statistical analysis conducted on geographies consisting of 499,136,938 people shows a slight positive correlation between the proportion of Immigrants from Eastern Asia and percentage of population with vision disability in the United States with a correlation coefficient (R) of 0.094 and weighted average of 1.8%. Similarly, the statistical analysis conducted on geographies consisting of 56,085,396 people shows a weak positive correlation between the proportion of Kiowa and percentage of population with vision disability in the United States with a correlation coefficient (R) of 0.294 and weighted average of 3.3%, a difference of 77.6%.
Vision Disability Correlation Summary
| Measurement | Immigrants from Eastern Asia | Kiowa |
| Minimum | 0.68% | 1.6% |
| Maximum | 5.9% | 15.0% |
| Range | 5.2% | 13.4% |
| Mean | 1.7% | 5.1% |
| Median | 1.6% | 4.1% |
| Interquartile 25% (IQ1) | 1.4% | 3.2% |
| Interquartile 75% (IQ3) | 1.8% | 4.9% |
| Interquartile Range (IQR) | 0.40% | 1.7% |
| Standard Deviation (Sample) | 0.65% | 3.3% |
| Standard Deviation (Population) | 0.65% | 3.2% |
Similar Demographics by Vision Disability
Demographics Similar to Immigrants from Eastern Asia by Vision Disability
In terms of vision disability, the demographic groups most similar to Immigrants from Eastern Asia are Immigrants from Korea (1.8%, a difference of 0.080%), Immigrants from China (1.8%, a difference of 0.15%), Immigrants from Israel (1.8%, a difference of 0.31%), Immigrants from Bolivia (1.8%, a difference of 0.57%), and Indian (Asian) (1.8%, a difference of 1.0%).
| Demographics | Rating | Rank | Vision Disability |
| Immigrants | Iran | 100.0 /100 | #6 | Exceptional 1.8% |
| Immigrants | South Central Asia | 100.0 /100 | #7 | Exceptional 1.8% |
| Iranians | 100.0 /100 | #8 | Exceptional 1.8% |
| Immigrants | Singapore | 100.0 /100 | #9 | Exceptional 1.8% |
| Immigrants | Hong Kong | 100.0 /100 | #10 | Exceptional 1.8% |
| Immigrants | Israel | 100.0 /100 | #11 | Exceptional 1.8% |
| Immigrants | Korea | 100.0 /100 | #12 | Exceptional 1.8% |
| Immigrants | Eastern Asia | 100.0 /100 | #13 | Exceptional 1.8% |
| Immigrants | China | 100.0 /100 | #14 | Exceptional 1.8% |
| Immigrants | Bolivia | 100.0 /100 | #15 | Exceptional 1.8% |
| Indians (Asian) | 100.0 /100 | #16 | Exceptional 1.8% |
| Burmese | 100.0 /100 | #17 | Exceptional 1.8% |
| Bolivians | 100.0 /100 | #18 | Exceptional 1.9% |
| Immigrants | Sri Lanka | 100.0 /100 | #19 | Exceptional 1.9% |
| Asians | 100.0 /100 | #20 | Exceptional 1.9% |
Demographics Similar to Kiowa by Vision Disability
In terms of vision disability, the demographic groups most similar to Kiowa are Choctaw (3.3%, a difference of 1.4%), Creek (3.2%, a difference of 1.4%), Tsimshian (3.2%, a difference of 1.6%), Chickasaw (3.2%, a difference of 2.3%), and Pima (3.3%, a difference of 2.5%).
| Demographics | Rating | Rank | Vision Disability |
| Cajuns | 0.0 /100 | #333 | Tragic 3.1% |
| Cheyenne | 0.0 /100 | #334 | Tragic 3.1% |
| Navajo | 0.0 /100 | #335 | Tragic 3.1% |
| Alaskan Athabascans | 0.0 /100 | #336 | Tragic 3.1% |
| Dutch West Indians | 0.0 /100 | #337 | Tragic 3.2% |
| Chickasaw | 0.0 /100 | #338 | Tragic 3.2% |
| Tsimshian | 0.0 /100 | #339 | Tragic 3.2% |
| Creek | 0.0 /100 | #340 | Tragic 3.2% |
| Kiowa | 0.0 /100 | #341 | Tragic 3.3% |
| Choctaw | 0.0 /100 | #342 | Tragic 3.3% |
| Pima | 0.0 /100 | #343 | Tragic 3.3% |
| Pueblo | 0.0 /100 | #344 | Tragic 3.3% |
| Lumbee | 0.0 /100 | #345 | Tragic 3.4% |
| Houma | 0.0 /100 | #346 | Tragic 3.4% |
| Puerto Ricans | 0.0 /100 | #347 | Tragic 3.9% |