Immigrants from Jamaica vs Salvadoran Single Mother Households
COMPARE
Immigrants from Jamaica
Salvadoran
Single Mother Households
Single Mother Households Comparison
Immigrants from Jamaica
Salvadorans
8.4%
SINGLE MOTHER HOUSEHOLDS
0.0/ 100
METRIC RATING
324th/ 347
METRIC RANK
7.5%
SINGLE MOTHER HOUSEHOLDS
0.1/ 100
METRIC RATING
271st/ 347
METRIC RANK
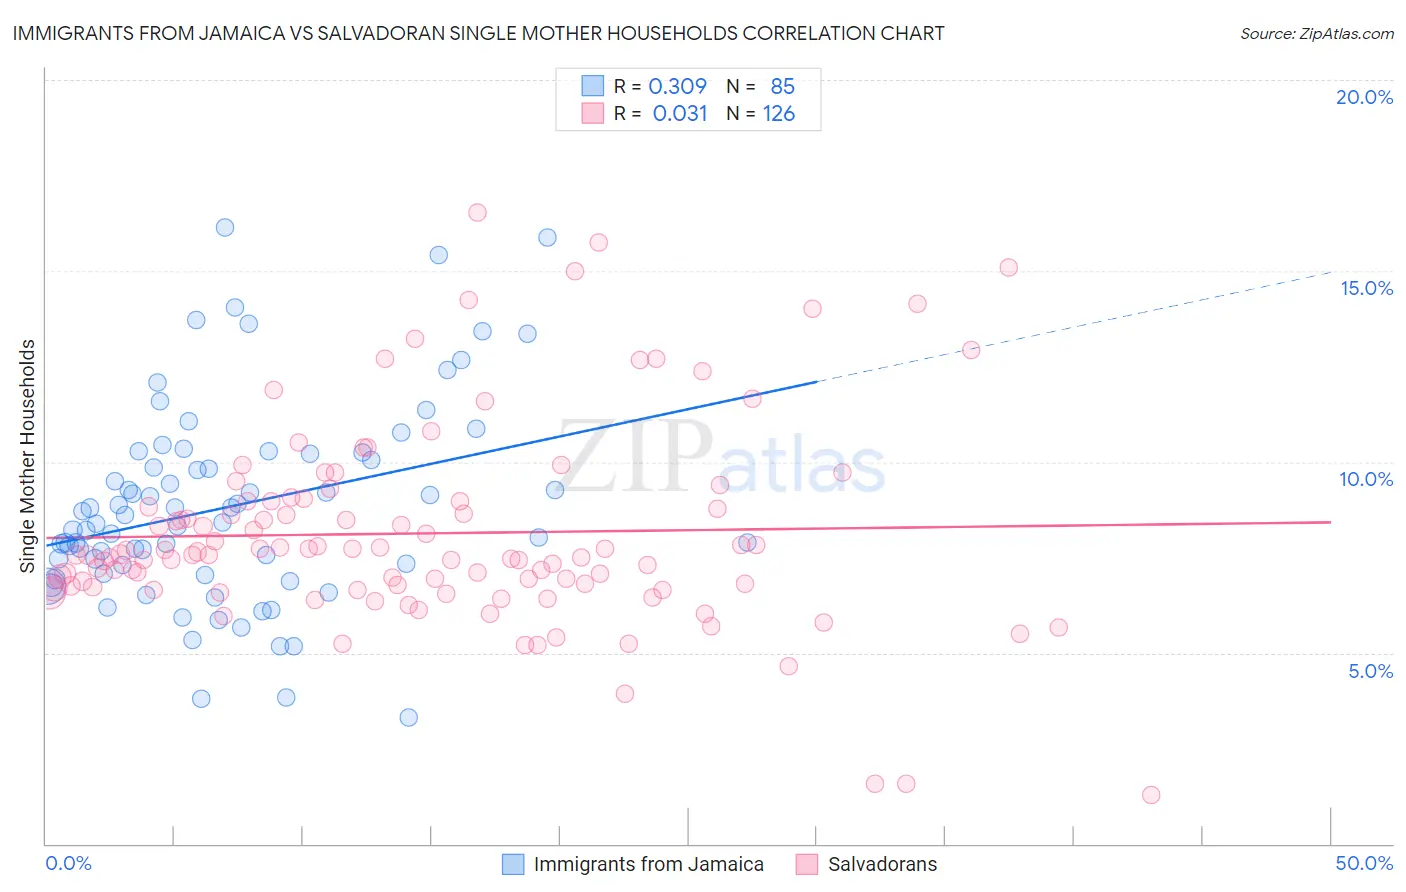
Immigrants from Jamaica vs Salvadoran Single Mother Households Correlation Chart
The statistical analysis conducted on geographies consisting of 301,259,043 people shows a mild positive correlation between the proportion of Immigrants from Jamaica and percentage of single mother households in the United States with a correlation coefficient (R) of 0.309 and weighted average of 8.4%. Similarly, the statistical analysis conducted on geographies consisting of 398,116,409 people shows no correlation between the proportion of Salvadorans and percentage of single mother households in the United States with a correlation coefficient (R) of 0.031 and weighted average of 7.5%, a difference of 11.0%.
Single Mother Households Correlation Summary
| Measurement | Immigrants from Jamaica | Salvadoran |
| Minimum | 3.3% | 1.3% |
| Maximum | 16.1% | 16.5% |
| Range | 12.8% | 15.3% |
| Mean | 8.8% | 8.1% |
| Median | 8.4% | 7.6% |
| Interquartile 25% (IQ1) | 7.2% | 6.7% |
| Interquartile 75% (IQ3) | 10.2% | 9.0% |
| Interquartile Range (IQR) | 3.0% | 2.3% |
| Standard Deviation (Sample) | 2.6% | 2.6% |
| Standard Deviation (Population) | 2.6% | 2.6% |
Similar Demographics by Single Mother Households
Demographics Similar to Immigrants from Jamaica by Single Mother Households
In terms of single mother households, the demographic groups most similar to Immigrants from Jamaica are Immigrants from Caribbean (8.4%, a difference of 0.18%), British West Indian (8.4%, a difference of 0.31%), Haitian (8.3%, a difference of 0.43%), Immigrants from Haiti (8.4%, a difference of 0.46%), and Yakama (8.4%, a difference of 0.63%).
| Demographics | Rating | Rank | Single Mother Households |
| Immigrants | Honduras | 0.0 /100 | #317 | Tragic 8.2% |
| Senegalese | 0.0 /100 | #318 | Tragic 8.2% |
| Jamaicans | 0.0 /100 | #319 | Tragic 8.2% |
| Bahamians | 0.0 /100 | #320 | Tragic 8.3% |
| Immigrants | Senegal | 0.0 /100 | #321 | Tragic 8.3% |
| Pima | 0.0 /100 | #322 | Tragic 8.3% |
| Haitians | 0.0 /100 | #323 | Tragic 8.3% |
| Immigrants | Jamaica | 0.0 /100 | #324 | Tragic 8.4% |
| Immigrants | Caribbean | 0.0 /100 | #325 | Tragic 8.4% |
| British West Indians | 0.0 /100 | #326 | Tragic 8.4% |
| Immigrants | Haiti | 0.0 /100 | #327 | Tragic 8.4% |
| Yakama | 0.0 /100 | #328 | Tragic 8.4% |
| Hopi | 0.0 /100 | #329 | Tragic 8.5% |
| Inupiat | 0.0 /100 | #330 | Tragic 8.5% |
| Sioux | 0.0 /100 | #331 | Tragic 8.5% |
Demographics Similar to Salvadorans by Single Mother Households
In terms of single mother households, the demographic groups most similar to Salvadorans are Immigrants from the Azores (7.5%, a difference of 0.0%), Immigrants from Cuba (7.5%, a difference of 0.090%), Somali (7.5%, a difference of 0.25%), Belizean (7.6%, a difference of 0.32%), and Immigrants from Guyana (7.6%, a difference of 0.36%).
| Demographics | Rating | Rank | Single Mother Households |
| Yaqui | 0.1 /100 | #264 | Tragic 7.4% |
| Crow | 0.1 /100 | #265 | Tragic 7.4% |
| Nepalese | 0.1 /100 | #266 | Tragic 7.5% |
| Blackfeet | 0.1 /100 | #267 | Tragic 7.5% |
| Indonesians | 0.1 /100 | #268 | Tragic 7.5% |
| Somalis | 0.1 /100 | #269 | Tragic 7.5% |
| Immigrants | Cuba | 0.1 /100 | #270 | Tragic 7.5% |
| Salvadorans | 0.1 /100 | #271 | Tragic 7.5% |
| Immigrants | Azores | 0.1 /100 | #272 | Tragic 7.5% |
| Belizeans | 0.1 /100 | #273 | Tragic 7.6% |
| Immigrants | Guyana | 0.1 /100 | #274 | Tragic 7.6% |
| Central American Indians | 0.1 /100 | #275 | Tragic 7.6% |
| Guyanese | 0.1 /100 | #276 | Tragic 7.6% |
| Immigrants | Trinidad and Tobago | 0.1 /100 | #277 | Tragic 7.6% |
| Central Americans | 0.1 /100 | #278 | Tragic 7.6% |