Immigrants from Denmark vs Ute Births to Unmarried Women
COMPARE
Immigrants from Denmark
Ute
Births to Unmarried Women
Births to Unmarried Women Comparison
Immigrants from Denmark
Ute
29.4%
BIRTHS TO UNMARRIED WOMEN
95.3/ 100
METRIC RATING
99th/ 347
METRIC RANK
33.0%
BIRTHS TO UNMARRIED WOMEN
14.4/ 100
METRIC RATING
203rd/ 347
METRIC RANK
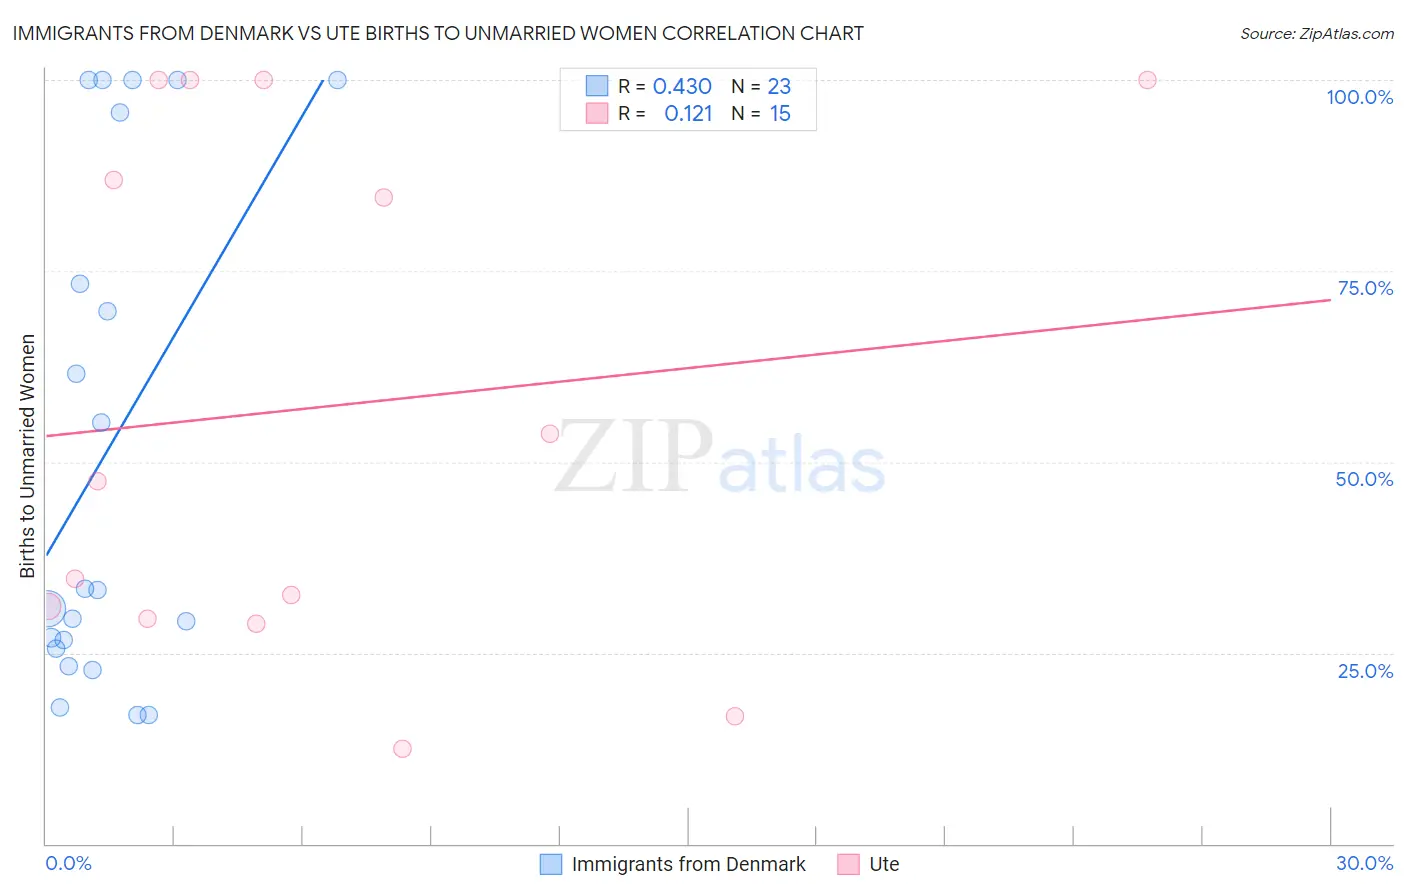
Immigrants from Denmark vs Ute Births to Unmarried Women Correlation Chart
The statistical analysis conducted on geographies consisting of 130,476,189 people shows a moderate positive correlation between the proportion of Immigrants from Denmark and percentage of births to unmarried women in the United States with a correlation coefficient (R) of 0.430 and weighted average of 29.4%. Similarly, the statistical analysis conducted on geographies consisting of 54,718,542 people shows a poor positive correlation between the proportion of Ute and percentage of births to unmarried women in the United States with a correlation coefficient (R) of 0.121 and weighted average of 33.0%, a difference of 12.2%.
Births to Unmarried Women Correlation Summary
| Measurement | Immigrants from Denmark | Ute |
| Minimum | 16.9% | 12.5% |
| Maximum | 100.0% | 100.0% |
| Range | 83.1% | 87.5% |
| Mean | 51.7% | 57.2% |
| Median | 33.3% | 47.5% |
| Interquartile 25% (IQ1) | 25.6% | 29.4% |
| Interquartile 75% (IQ3) | 95.7% | 100.0% |
| Interquartile Range (IQR) | 70.1% | 70.6% |
| Standard Deviation (Sample) | 32.9% | 33.9% |
| Standard Deviation (Population) | 32.1% | 32.7% |
Similar Demographics by Births to Unmarried Women
Demographics Similar to Immigrants from Denmark by Births to Unmarried Women
In terms of births to unmarried women, the demographic groups most similar to Immigrants from Denmark are Luxembourger (29.4%, a difference of 0.0%), Immigrants from Syria (29.4%, a difference of 0.24%), Immigrants from South Africa (29.3%, a difference of 0.26%), Immigrants from Northern Africa (29.5%, a difference of 0.29%), and Norwegian (29.3%, a difference of 0.30%).
| Demographics | Rating | Rank | Births to Unmarried Women |
| Arabs | 96.5 /100 | #92 | Exceptional 29.2% |
| Estonians | 96.5 /100 | #93 | Exceptional 29.2% |
| Ukrainians | 96.3 /100 | #94 | Exceptional 29.2% |
| Immigrants | Vietnam | 96.1 /100 | #95 | Exceptional 29.3% |
| Norwegians | 95.8 /100 | #96 | Exceptional 29.3% |
| Immigrants | South Africa | 95.7 /100 | #97 | Exceptional 29.3% |
| Immigrants | Syria | 95.7 /100 | #98 | Exceptional 29.4% |
| Immigrants | Denmark | 95.3 /100 | #99 | Exceptional 29.4% |
| Luxembourgers | 95.2 /100 | #100 | Exceptional 29.4% |
| Immigrants | Northern Africa | 94.7 /100 | #101 | Exceptional 29.5% |
| Australians | 94.6 /100 | #102 | Exceptional 29.5% |
| Lebanese | 94.4 /100 | #103 | Exceptional 29.5% |
| Lithuanians | 94.4 /100 | #104 | Exceptional 29.6% |
| Immigrants | Nepal | 94.3 /100 | #105 | Exceptional 29.6% |
| Swedes | 93.8 /100 | #106 | Exceptional 29.6% |
Demographics Similar to Ute by Births to Unmarried Women
In terms of births to unmarried women, the demographic groups most similar to Ute are Immigrants from Africa (33.0%, a difference of 0.020%), German Russian (33.1%, a difference of 0.25%), Uruguayan (33.1%, a difference of 0.31%), Immigrants from Micronesia (32.9%, a difference of 0.38%), and Immigrants from Burma/Myanmar (32.9%, a difference of 0.39%).
| Demographics | Rating | Rank | Births to Unmarried Women |
| Immigrants | Colombia | 21.7 /100 | #196 | Fair 32.6% |
| Immigrants | Immigrants | 20.6 /100 | #197 | Fair 32.7% |
| Costa Ricans | 20.3 /100 | #198 | Fair 32.7% |
| Immigrants | Thailand | 18.9 /100 | #199 | Poor 32.8% |
| Immigrants | Germany | 18.8 /100 | #200 | Poor 32.8% |
| Immigrants | Burma/Myanmar | 16.7 /100 | #201 | Poor 32.9% |
| Immigrants | Micronesia | 16.6 /100 | #202 | Poor 32.9% |
| Ute | 14.4 /100 | #203 | Poor 33.0% |
| Immigrants | Africa | 14.3 /100 | #204 | Poor 33.0% |
| German Russians | 13.1 /100 | #205 | Poor 33.1% |
| Uruguayans | 12.8 /100 | #206 | Poor 33.1% |
| Immigrants | Sudan | 11.5 /100 | #207 | Poor 33.2% |
| Hawaiians | 11.3 /100 | #208 | Poor 33.2% |
| Whites/Caucasians | 10.7 /100 | #209 | Poor 33.3% |
| Scotch-Irish | 10.7 /100 | #210 | Poor 33.3% |