Immigrants from South Eastern Asia vs South American Indian Divorced or Separated
COMPARE
Immigrants from South Eastern Asia
South American Indian
Divorced or Separated
Divorced or Separated Comparison
Immigrants from South Eastern Asia
South American Indians
11.4%
DIVORCED OR SEPARATED
99.8/ 100
METRIC RATING
65th/ 347
METRIC RANK
11.8%
DIVORCED OR SEPARATED
92.1/ 100
METRIC RATING
126th/ 347
METRIC RANK
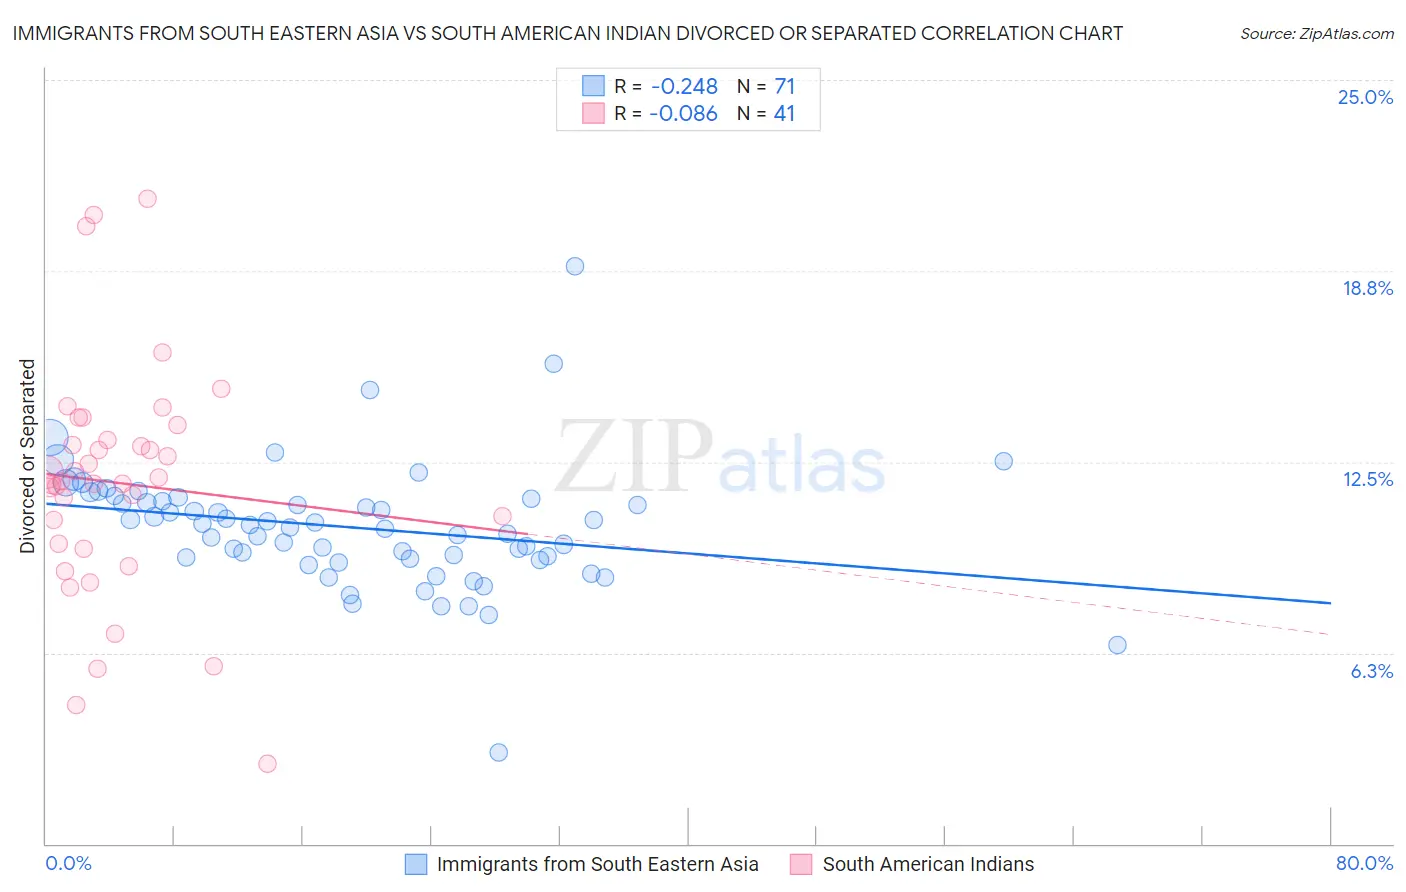
Immigrants from South Eastern Asia vs South American Indian Divorced or Separated Correlation Chart
The statistical analysis conducted on geographies consisting of 512,413,188 people shows a weak negative correlation between the proportion of Immigrants from South Eastern Asia and percentage of population currently divorced or separated in the United States with a correlation coefficient (R) of -0.248 and weighted average of 11.4%. Similarly, the statistical analysis conducted on geographies consisting of 164,560,857 people shows a slight negative correlation between the proportion of South American Indians and percentage of population currently divorced or separated in the United States with a correlation coefficient (R) of -0.086 and weighted average of 11.8%, a difference of 3.4%.
Divorced or Separated Correlation Summary
| Measurement | Immigrants from South Eastern Asia | South American Indian |
| Minimum | 3.0% | 2.6% |
| Maximum | 18.9% | 21.1% |
| Range | 15.9% | 18.5% |
| Mean | 10.4% | 11.8% |
| Median | 10.4% | 11.9% |
| Interquartile 25% (IQ1) | 9.3% | 9.7% |
| Interquartile 75% (IQ3) | 11.3% | 13.4% |
| Interquartile Range (IQR) | 2.0% | 3.7% |
| Standard Deviation (Sample) | 2.1% | 3.8% |
| Standard Deviation (Population) | 2.1% | 3.8% |
Similar Demographics by Divorced or Separated
Demographics Similar to Immigrants from South Eastern Asia by Divorced or Separated
In terms of divorced or separated, the demographic groups most similar to Immigrants from South Eastern Asia are Macedonian (11.4%, a difference of 0.040%), Inupiat (11.4%, a difference of 0.14%), Immigrants from Syria (11.4%, a difference of 0.23%), Palestinian (11.5%, a difference of 0.34%), and Immigrants from Belgium (11.5%, a difference of 0.34%).
| Demographics | Rating | Rank | Divorced or Separated |
| Sri Lankans | 99.9 /100 | #58 | Exceptional 11.3% |
| Israelis | 99.9 /100 | #59 | Exceptional 11.3% |
| Immigrants | Russia | 99.9 /100 | #60 | Exceptional 11.3% |
| Koreans | 99.9 /100 | #61 | Exceptional 11.3% |
| Luxembourgers | 99.9 /100 | #62 | Exceptional 11.3% |
| Immigrants | Kuwait | 99.9 /100 | #63 | Exceptional 11.3% |
| Macedonians | 99.8 /100 | #64 | Exceptional 11.4% |
| Immigrants | South Eastern Asia | 99.8 /100 | #65 | Exceptional 11.4% |
| Inupiat | 99.8 /100 | #66 | Exceptional 11.4% |
| Immigrants | Syria | 99.7 /100 | #67 | Exceptional 11.4% |
| Palestinians | 99.7 /100 | #68 | Exceptional 11.5% |
| Immigrants | Belgium | 99.7 /100 | #69 | Exceptional 11.5% |
| Immigrants | Eastern Europe | 99.7 /100 | #70 | Exceptional 11.5% |
| Paraguayans | 99.7 /100 | #71 | Exceptional 11.5% |
| Jordanians | 99.6 /100 | #72 | Exceptional 11.5% |
Demographics Similar to South American Indians by Divorced or Separated
In terms of divorced or separated, the demographic groups most similar to South American Indians are Ukrainian (11.8%, a difference of 0.020%), Ugandan (11.8%, a difference of 0.13%), Immigrants (11.8%, a difference of 0.21%), Menominee (11.8%, a difference of 0.22%), and Romanian (11.8%, a difference of 0.34%).
| Demographics | Rating | Rank | Divorced or Separated |
| Syrians | 95.1 /100 | #119 | Exceptional 11.7% |
| Iraqis | 94.6 /100 | #120 | Exceptional 11.8% |
| Romanians | 94.5 /100 | #121 | Exceptional 11.8% |
| Menominee | 93.8 /100 | #122 | Exceptional 11.8% |
| Immigrants | Immigrants | 93.7 /100 | #123 | Exceptional 11.8% |
| Ugandans | 93.1 /100 | #124 | Exceptional 11.8% |
| Ukrainians | 92.3 /100 | #125 | Exceptional 11.8% |
| South American Indians | 92.1 /100 | #126 | Exceptional 11.8% |
| South Africans | 88.9 /100 | #127 | Excellent 11.8% |
| Immigrants | Ecuador | 88.9 /100 | #128 | Excellent 11.8% |
| Immigrants | St. Vincent and the Grenadines | 88.4 /100 | #129 | Excellent 11.8% |
| Immigrants | Austria | 88.2 /100 | #130 | Excellent 11.8% |
| Immigrants | Cambodia | 88.2 /100 | #131 | Excellent 11.8% |
| Immigrants | Afghanistan | 87.9 /100 | #132 | Excellent 11.8% |
| New Zealanders | 87.5 /100 | #133 | Excellent 11.9% |