Immigrants from Czechoslovakia vs Paiute Average Family Size
COMPARE
Immigrants from Czechoslovakia
Paiute
Average Family Size
Average Family Size Comparison
Immigrants from Czechoslovakia
Paiute
3.14
AVERAGE FAMILY SIZE
0.3/ 100
METRIC RATING
288th/ 347
METRIC RANK
3.29
AVERAGE FAMILY SIZE
98.0/ 100
METRIC RATING
106th/ 347
METRIC RANK
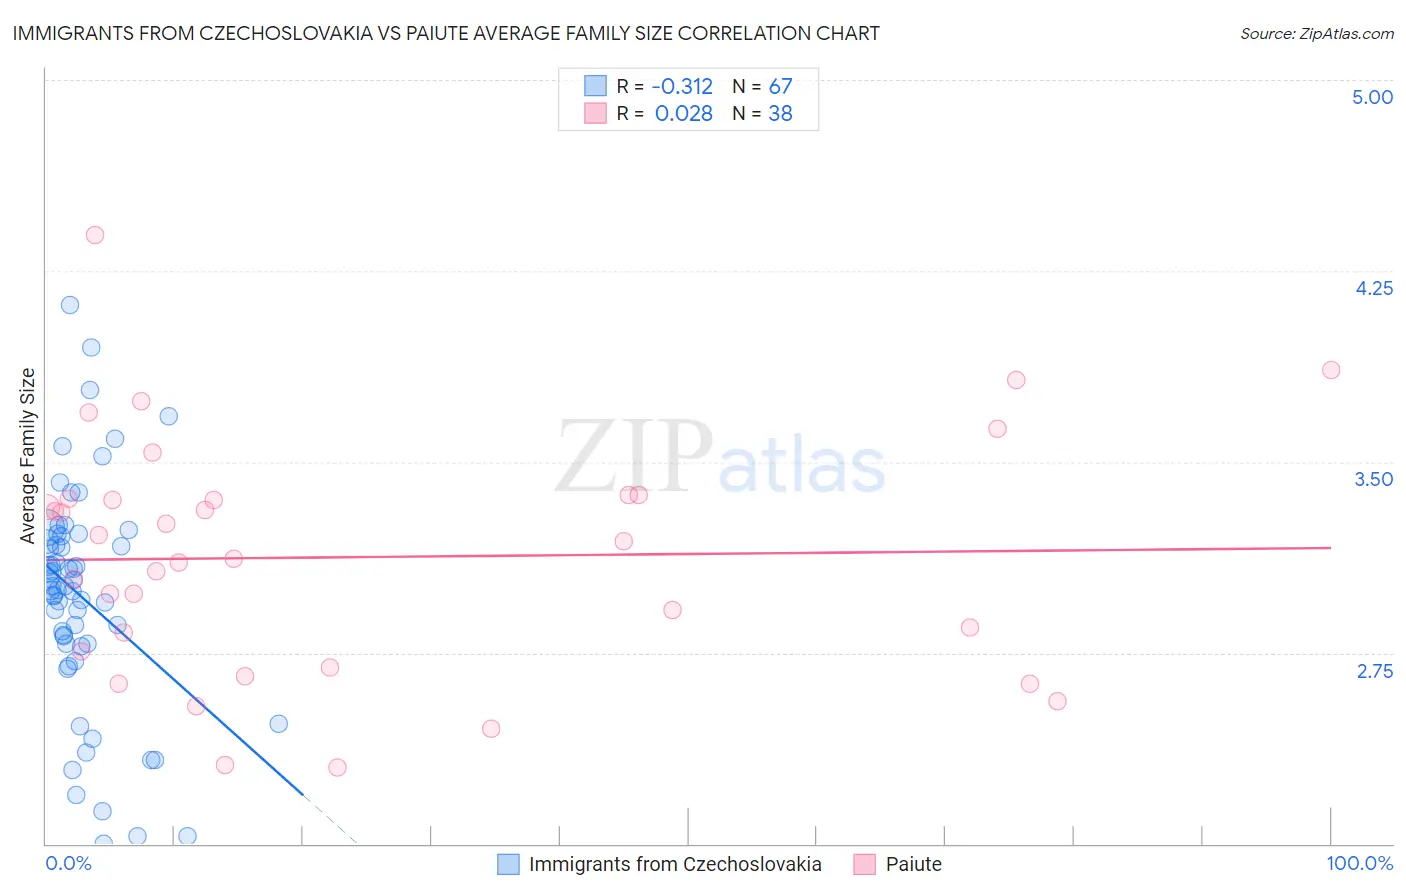
Immigrants from Czechoslovakia vs Paiute Average Family Size Correlation Chart
The statistical analysis conducted on geographies consisting of 195,446,712 people shows a mild negative correlation between the proportion of Immigrants from Czechoslovakia and average family size in the United States with a correlation coefficient (R) of -0.312 and weighted average of 3.14. Similarly, the statistical analysis conducted on geographies consisting of 58,392,138 people shows no correlation between the proportion of Paiute and average family size in the United States with a correlation coefficient (R) of 0.028 and weighted average of 3.29, a difference of 4.6%.
Average Family Size Correlation Summary
| Measurement | Immigrants from Czechoslovakia | Paiute |
| Minimum | 2.00 | 2.30 |
| Maximum | 4.12 | 4.39 |
| Range | 2.12 | 2.09 |
| Mean | 2.97 | 3.13 |
| Median | 3.01 | 3.15 |
| Interquartile 25% (IQ1) | 2.79 | 2.76 |
| Interquartile 75% (IQ3) | 3.21 | 3.35 |
| Interquartile Range (IQR) | 0.42 | 0.60 |
| Standard Deviation (Sample) | 0.44 | 0.46 |
| Standard Deviation (Population) | 0.44 | 0.46 |
Similar Demographics by Average Family Size
Demographics Similar to Immigrants from Czechoslovakia by Average Family Size
In terms of average family size, the demographic groups most similar to Immigrants from Czechoslovakia are Greek (3.14, a difference of 0.0%), Immigrants from Norway (3.14, a difference of 0.0%), Immigrants from Netherlands (3.14, a difference of 0.010%), Cypriot (3.14, a difference of 0.030%), and White/Caucasian (3.14, a difference of 0.060%).
| Demographics | Rating | Rank | Average Family Size |
| Immigrants | Denmark | 0.4 /100 | #281 | Tragic 3.15 |
| Yugoslavians | 0.4 /100 | #282 | Tragic 3.15 |
| German Russians | 0.4 /100 | #283 | Tragic 3.15 |
| Immigrants | France | 0.4 /100 | #284 | Tragic 3.15 |
| Whites/Caucasians | 0.3 /100 | #285 | Tragic 3.14 |
| Immigrants | Netherlands | 0.3 /100 | #286 | Tragic 3.14 |
| Greeks | 0.3 /100 | #287 | Tragic 3.14 |
| Immigrants | Czechoslovakia | 0.3 /100 | #288 | Tragic 3.14 |
| Immigrants | Norway | 0.3 /100 | #289 | Tragic 3.14 |
| Cypriots | 0.3 /100 | #290 | Tragic 3.14 |
| Alsatians | 0.2 /100 | #291 | Tragic 3.14 |
| Europeans | 0.2 /100 | #292 | Tragic 3.14 |
| Scandinavians | 0.2 /100 | #293 | Tragic 3.14 |
| Immigrants | Croatia | 0.2 /100 | #294 | Tragic 3.14 |
| Austrians | 0.2 /100 | #295 | Tragic 3.14 |
Demographics Similar to Paiute by Average Family Size
In terms of average family size, the demographic groups most similar to Paiute are Immigrants from Ghana (3.29, a difference of 0.020%), Ghanaian (3.29, a difference of 0.020%), Bolivian (3.29, a difference of 0.070%), Immigrants from Western Africa (3.29, a difference of 0.11%), and West Indian (3.29, a difference of 0.13%).
| Demographics | Rating | Rank | Average Family Size |
| Nigerians | 98.6 /100 | #99 | Exceptional 3.29 |
| Guamanians/Chamorros | 98.6 /100 | #100 | Exceptional 3.29 |
| Immigrants | Burma/Myanmar | 98.6 /100 | #101 | Exceptional 3.29 |
| West Indians | 98.5 /100 | #102 | Exceptional 3.29 |
| Immigrants | Western Africa | 98.4 /100 | #103 | Exceptional 3.29 |
| Bolivians | 98.3 /100 | #104 | Exceptional 3.29 |
| Immigrants | Ghana | 98.1 /100 | #105 | Exceptional 3.29 |
| Paiute | 98.0 /100 | #106 | Exceptional 3.29 |
| Ghanaians | 98.0 /100 | #107 | Exceptional 3.29 |
| Asians | 97.0 /100 | #108 | Exceptional 3.28 |
| Puerto Ricans | 96.7 /100 | #109 | Exceptional 3.28 |
| Bahamians | 96.6 /100 | #110 | Exceptional 3.28 |
| Indonesians | 96.2 /100 | #111 | Exceptional 3.28 |
| Blacks/African Americans | 95.7 /100 | #112 | Exceptional 3.27 |
| Immigrants | Panama | 95.6 /100 | #113 | Exceptional 3.27 |