Immigrants from Czechoslovakia vs Maltese Average Family Size
COMPARE
Immigrants from Czechoslovakia
Maltese
Average Family Size
Average Family Size Comparison
Immigrants from Czechoslovakia
Maltese
3.14
AVERAGE FAMILY SIZE
0.3/ 100
METRIC RATING
288th/ 347
METRIC RANK
3.16
AVERAGE FAMILY SIZE
0.8/ 100
METRIC RATING
268th/ 347
METRIC RANK
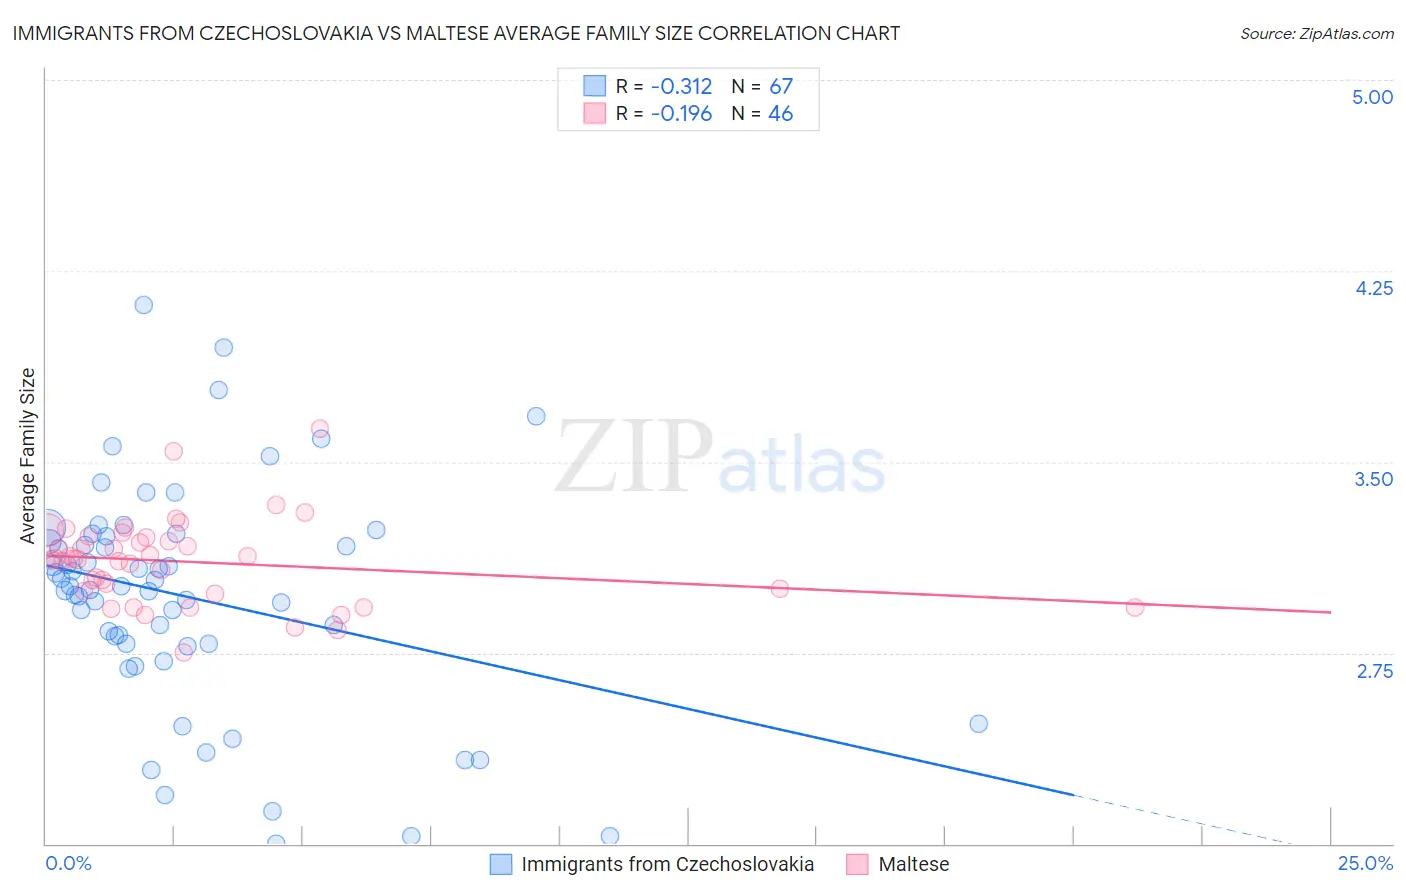
Immigrants from Czechoslovakia vs Maltese Average Family Size Correlation Chart
The statistical analysis conducted on geographies consisting of 195,446,712 people shows a mild negative correlation between the proportion of Immigrants from Czechoslovakia and average family size in the United States with a correlation coefficient (R) of -0.312 and weighted average of 3.14. Similarly, the statistical analysis conducted on geographies consisting of 126,422,632 people shows a poor negative correlation between the proportion of Maltese and average family size in the United States with a correlation coefficient (R) of -0.196 and weighted average of 3.16, a difference of 0.46%.
Average Family Size Correlation Summary
| Measurement | Immigrants from Czechoslovakia | Maltese |
| Minimum | 2.00 | 2.75 |
| Maximum | 4.12 | 3.63 |
| Range | 2.12 | 0.88 |
| Mean | 2.97 | 3.11 |
| Median | 3.01 | 3.12 |
| Interquartile 25% (IQ1) | 2.79 | 2.99 |
| Interquartile 75% (IQ3) | 3.21 | 3.20 |
| Interquartile Range (IQR) | 0.42 | 0.21 |
| Standard Deviation (Sample) | 0.44 | 0.17 |
| Standard Deviation (Population) | 0.44 | 0.17 |
Demographics Similar to Immigrants from Czechoslovakia and Maltese by Average Family Size
In terms of average family size, the demographic groups most similar to Immigrants from Czechoslovakia are Greek (3.14, a difference of 0.0%), Immigrants from Netherlands (3.14, a difference of 0.010%), White/Caucasian (3.14, a difference of 0.060%), Immigrants from France (3.15, a difference of 0.11%), and German Russian (3.15, a difference of 0.13%). Similarly, the demographic groups most similar to Maltese are Immigrants from Singapore (3.16, a difference of 0.010%), Tlingit-Haida (3.16, a difference of 0.040%), Immigrants from Germany (3.15, a difference of 0.060%), Immigrants from Lithuania (3.15, a difference of 0.080%), and New Zealander (3.15, a difference of 0.10%).
| Demographics | Rating | Rank | Average Family Size |
| Maltese | 0.8 /100 | #268 | Tragic 3.16 |
| Immigrants | Singapore | 0.7 /100 | #269 | Tragic 3.16 |
| Tlingit-Haida | 0.7 /100 | #270 | Tragic 3.16 |
| Immigrants | Germany | 0.7 /100 | #271 | Tragic 3.15 |
| Immigrants | Lithuania | 0.6 /100 | #272 | Tragic 3.15 |
| New Zealanders | 0.6 /100 | #273 | Tragic 3.15 |
| Immigrants | Belgium | 0.6 /100 | #274 | Tragic 3.15 |
| Cambodians | 0.6 /100 | #275 | Tragic 3.15 |
| Immigrants | Bosnia and Herzegovina | 0.5 /100 | #276 | Tragic 3.15 |
| Swiss | 0.5 /100 | #277 | Tragic 3.15 |
| Okinawans | 0.5 /100 | #278 | Tragic 3.15 |
| Immigrants | Europe | 0.5 /100 | #279 | Tragic 3.15 |
| Immigrants | England | 0.4 /100 | #280 | Tragic 3.15 |
| Immigrants | Denmark | 0.4 /100 | #281 | Tragic 3.15 |
| Yugoslavians | 0.4 /100 | #282 | Tragic 3.15 |
| German Russians | 0.4 /100 | #283 | Tragic 3.15 |
| Immigrants | France | 0.4 /100 | #284 | Tragic 3.15 |
| Whites/Caucasians | 0.3 /100 | #285 | Tragic 3.14 |
| Immigrants | Netherlands | 0.3 /100 | #286 | Tragic 3.14 |
| Greeks | 0.3 /100 | #287 | Tragic 3.14 |
| Immigrants | Czechoslovakia | 0.3 /100 | #288 | Tragic 3.14 |