Sri Lankan vs Paiute Average Family Size
COMPARE
Sri Lankan
Paiute
Average Family Size
Average Family Size Comparison
Sri Lankans
Paiute
3.35
AVERAGE FAMILY SIZE
100.0/ 100
METRIC RATING
57th/ 347
METRIC RANK
3.29
AVERAGE FAMILY SIZE
98.0/ 100
METRIC RATING
106th/ 347
METRIC RANK
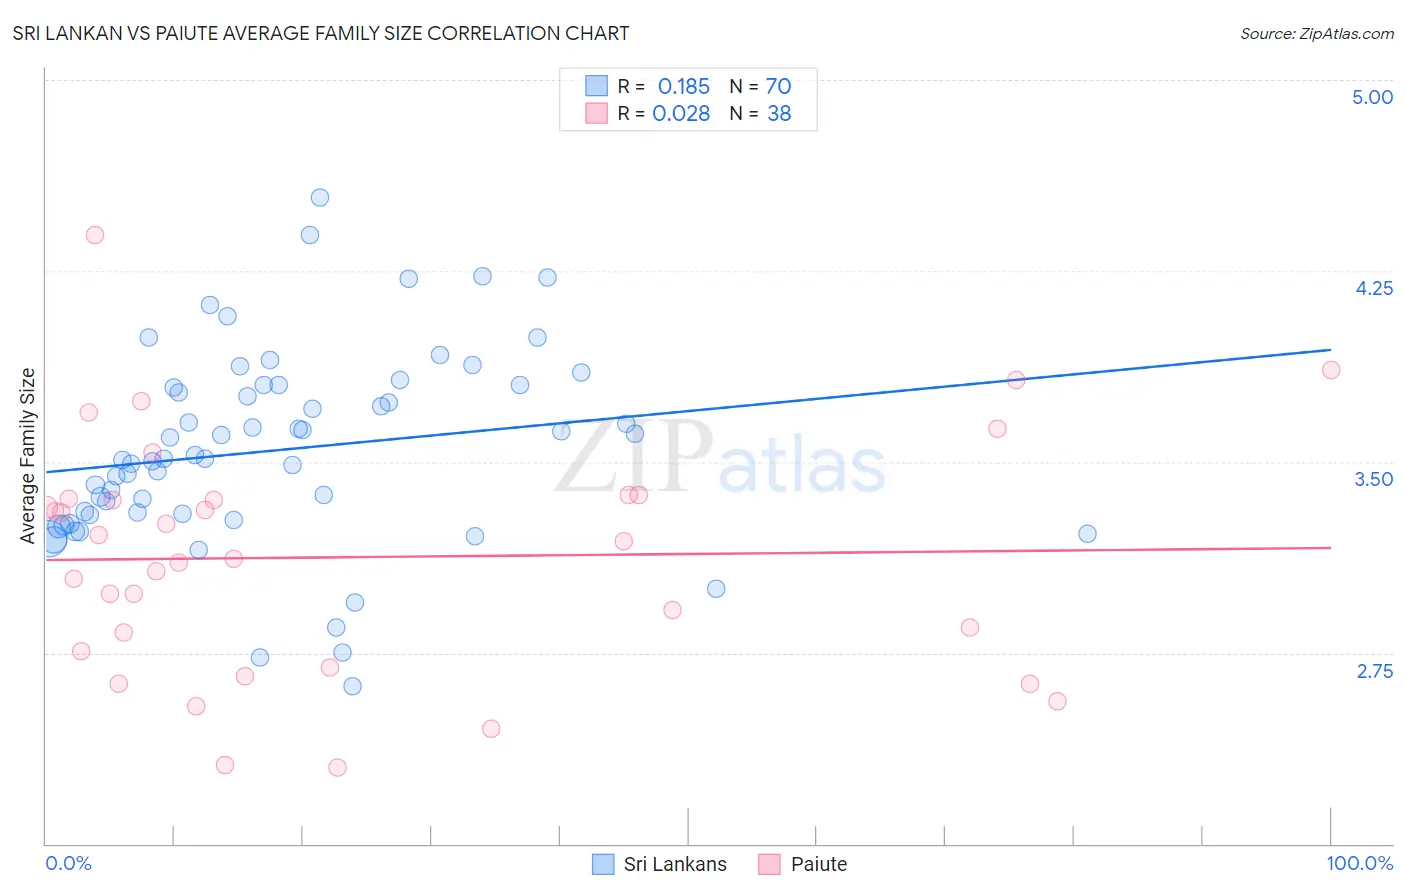
Sri Lankan vs Paiute Average Family Size Correlation Chart
The statistical analysis conducted on geographies consisting of 440,097,378 people shows a poor positive correlation between the proportion of Sri Lankans and average family size in the United States with a correlation coefficient (R) of 0.185 and weighted average of 3.35. Similarly, the statistical analysis conducted on geographies consisting of 58,392,138 people shows no correlation between the proportion of Paiute and average family size in the United States with a correlation coefficient (R) of 0.028 and weighted average of 3.29, a difference of 2.0%.
Average Family Size Correlation Summary
| Measurement | Sri Lankan | Paiute |
| Minimum | 2.62 | 2.30 |
| Maximum | 4.54 | 4.39 |
| Range | 1.92 | 2.09 |
| Mean | 3.55 | 3.13 |
| Median | 3.51 | 3.15 |
| Interquartile 25% (IQ1) | 3.29 | 2.76 |
| Interquartile 75% (IQ3) | 3.80 | 3.35 |
| Interquartile Range (IQR) | 0.51 | 0.60 |
| Standard Deviation (Sample) | 0.38 | 0.46 |
| Standard Deviation (Population) | 0.38 | 0.46 |
Similar Demographics by Average Family Size
Demographics Similar to Sri Lankans by Average Family Size
In terms of average family size, the demographic groups most similar to Sri Lankans are Honduran (3.35, a difference of 0.010%), Immigrants from Dominican Republic (3.35, a difference of 0.060%), Japanese (3.35, a difference of 0.10%), Immigrants from Honduras (3.36, a difference of 0.12%), and Immigrants from Armenia (3.35, a difference of 0.12%).
| Demographics | Rating | Rank | Average Family Size |
| Immigrants | Bangladesh | 100.0 /100 | #50 | Exceptional 3.36 |
| Nicaraguans | 100.0 /100 | #51 | Exceptional 3.36 |
| Fijians | 100.0 /100 | #52 | Exceptional 3.36 |
| Koreans | 100.0 /100 | #53 | Exceptional 3.36 |
| Immigrants | South Eastern Asia | 100.0 /100 | #54 | Exceptional 3.36 |
| Immigrants | Honduras | 100.0 /100 | #55 | Exceptional 3.36 |
| Immigrants | Dominican Republic | 100.0 /100 | #56 | Exceptional 3.35 |
| Sri Lankans | 100.0 /100 | #57 | Exceptional 3.35 |
| Hondurans | 100.0 /100 | #58 | Exceptional 3.35 |
| Japanese | 100.0 /100 | #59 | Exceptional 3.35 |
| Immigrants | Armenia | 100.0 /100 | #60 | Exceptional 3.35 |
| Central American Indians | 100.0 /100 | #61 | Exceptional 3.35 |
| Immigrants | Grenada | 100.0 /100 | #62 | Exceptional 3.34 |
| Chinese | 100.0 /100 | #63 | Exceptional 3.34 |
| Dominicans | 99.9 /100 | #64 | Exceptional 3.34 |
Demographics Similar to Paiute by Average Family Size
In terms of average family size, the demographic groups most similar to Paiute are Immigrants from Ghana (3.29, a difference of 0.020%), Ghanaian (3.29, a difference of 0.020%), Bolivian (3.29, a difference of 0.070%), Immigrants from Western Africa (3.29, a difference of 0.11%), and West Indian (3.29, a difference of 0.13%).
| Demographics | Rating | Rank | Average Family Size |
| Nigerians | 98.6 /100 | #99 | Exceptional 3.29 |
| Guamanians/Chamorros | 98.6 /100 | #100 | Exceptional 3.29 |
| Immigrants | Burma/Myanmar | 98.6 /100 | #101 | Exceptional 3.29 |
| West Indians | 98.5 /100 | #102 | Exceptional 3.29 |
| Immigrants | Western Africa | 98.4 /100 | #103 | Exceptional 3.29 |
| Bolivians | 98.3 /100 | #104 | Exceptional 3.29 |
| Immigrants | Ghana | 98.1 /100 | #105 | Exceptional 3.29 |
| Paiute | 98.0 /100 | #106 | Exceptional 3.29 |
| Ghanaians | 98.0 /100 | #107 | Exceptional 3.29 |
| Asians | 97.0 /100 | #108 | Exceptional 3.28 |
| Puerto Ricans | 96.7 /100 | #109 | Exceptional 3.28 |
| Bahamians | 96.6 /100 | #110 | Exceptional 3.28 |
| Indonesians | 96.2 /100 | #111 | Exceptional 3.28 |
| Blacks/African Americans | 95.7 /100 | #112 | Exceptional 3.27 |
| Immigrants | Panama | 95.6 /100 | #113 | Exceptional 3.27 |