Immigrants from Bolivia vs Paiute Average Family Size
COMPARE
Immigrants from Bolivia
Paiute
Average Family Size
Average Family Size Comparison
Immigrants from Bolivia
Paiute
3.31
AVERAGE FAMILY SIZE
99.6/ 100
METRIC RATING
88th/ 347
METRIC RANK
3.29
AVERAGE FAMILY SIZE
98.0/ 100
METRIC RATING
106th/ 347
METRIC RANK
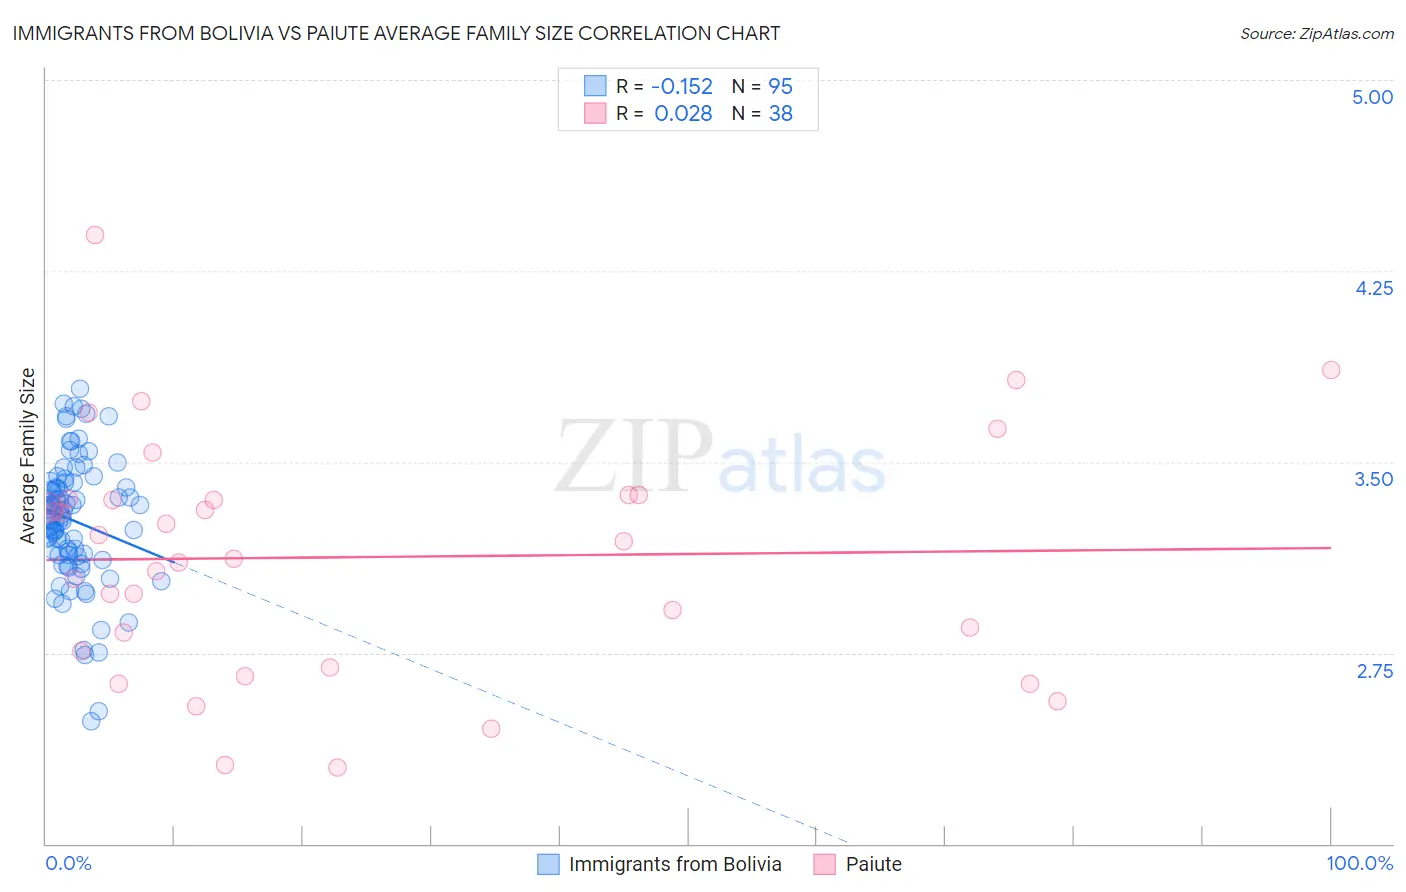
Immigrants from Bolivia vs Paiute Average Family Size Correlation Chart
The statistical analysis conducted on geographies consisting of 158,712,617 people shows a poor negative correlation between the proportion of Immigrants from Bolivia and average family size in the United States with a correlation coefficient (R) of -0.152 and weighted average of 3.31. Similarly, the statistical analysis conducted on geographies consisting of 58,392,138 people shows no correlation between the proportion of Paiute and average family size in the United States with a correlation coefficient (R) of 0.028 and weighted average of 3.29, a difference of 0.69%.
Average Family Size Correlation Summary
| Measurement | Immigrants from Bolivia | Paiute |
| Minimum | 2.48 | 2.30 |
| Maximum | 3.79 | 4.39 |
| Range | 1.31 | 2.09 |
| Mean | 3.27 | 3.13 |
| Median | 3.29 | 3.15 |
| Interquartile 25% (IQ1) | 3.13 | 2.76 |
| Interquartile 75% (IQ3) | 3.42 | 3.35 |
| Interquartile Range (IQR) | 0.28 | 0.60 |
| Standard Deviation (Sample) | 0.25 | 0.46 |
| Standard Deviation (Population) | 0.25 | 0.46 |
Demographics Similar to Immigrants from Bolivia and Paiute by Average Family Size
In terms of average family size, the demographic groups most similar to Immigrants from Bolivia are Malaysian (3.31, a difference of 0.010%), Immigrants from Peru (3.31, a difference of 0.090%), Menominee (3.30, a difference of 0.12%), Immigrants from Pakistan (3.30, a difference of 0.27%), and Immigrants from Cameroon (3.30, a difference of 0.28%). Similarly, the demographic groups most similar to Paiute are Immigrants from Ghana (3.29, a difference of 0.020%), Ghanaian (3.29, a difference of 0.020%), Bolivian (3.29, a difference of 0.070%), Immigrants from Western Africa (3.29, a difference of 0.11%), and West Indian (3.29, a difference of 0.13%).
| Demographics | Rating | Rank | Average Family Size |
| Immigrants | Peru | 99.7 /100 | #87 | Exceptional 3.31 |
| Immigrants | Bolivia | 99.6 /100 | #88 | Exceptional 3.31 |
| Malaysians | 99.6 /100 | #89 | Exceptional 3.31 |
| Menominee | 99.4 /100 | #90 | Exceptional 3.30 |
| Immigrants | Pakistan | 99.2 /100 | #91 | Exceptional 3.30 |
| Immigrants | Cameroon | 99.2 /100 | #92 | Exceptional 3.30 |
| Peruvians | 99.2 /100 | #93 | Exceptional 3.30 |
| Sierra Leoneans | 99.0 /100 | #94 | Exceptional 3.30 |
| Immigrants | Lebanon | 99.0 /100 | #95 | Exceptional 3.30 |
| U.S. Virgin Islanders | 98.8 /100 | #96 | Exceptional 3.29 |
| Immigrants | Oceania | 98.7 /100 | #97 | Exceptional 3.29 |
| Barbadians | 98.6 /100 | #98 | Exceptional 3.29 |
| Nigerians | 98.6 /100 | #99 | Exceptional 3.29 |
| Guamanians/Chamorros | 98.6 /100 | #100 | Exceptional 3.29 |
| Immigrants | Burma/Myanmar | 98.6 /100 | #101 | Exceptional 3.29 |
| West Indians | 98.5 /100 | #102 | Exceptional 3.29 |
| Immigrants | Western Africa | 98.4 /100 | #103 | Exceptional 3.29 |
| Bolivians | 98.3 /100 | #104 | Exceptional 3.29 |
| Immigrants | Ghana | 98.1 /100 | #105 | Exceptional 3.29 |
| Paiute | 98.0 /100 | #106 | Exceptional 3.29 |
| Ghanaians | 98.0 /100 | #107 | Exceptional 3.29 |