Immigrants from Congo vs Immigrants from Norway Currently Married
COMPARE
Immigrants from Congo
Immigrants from Norway
Currently Married
Currently Married Comparison
Immigrants from Congo
Immigrants from Norway
41.1%
CURRENTLY MARRIED
0.0/ 100
METRIC RATING
321st/ 347
METRIC RANK
47.2%
CURRENTLY MARRIED
79.7/ 100
METRIC RATING
135th/ 347
METRIC RANK
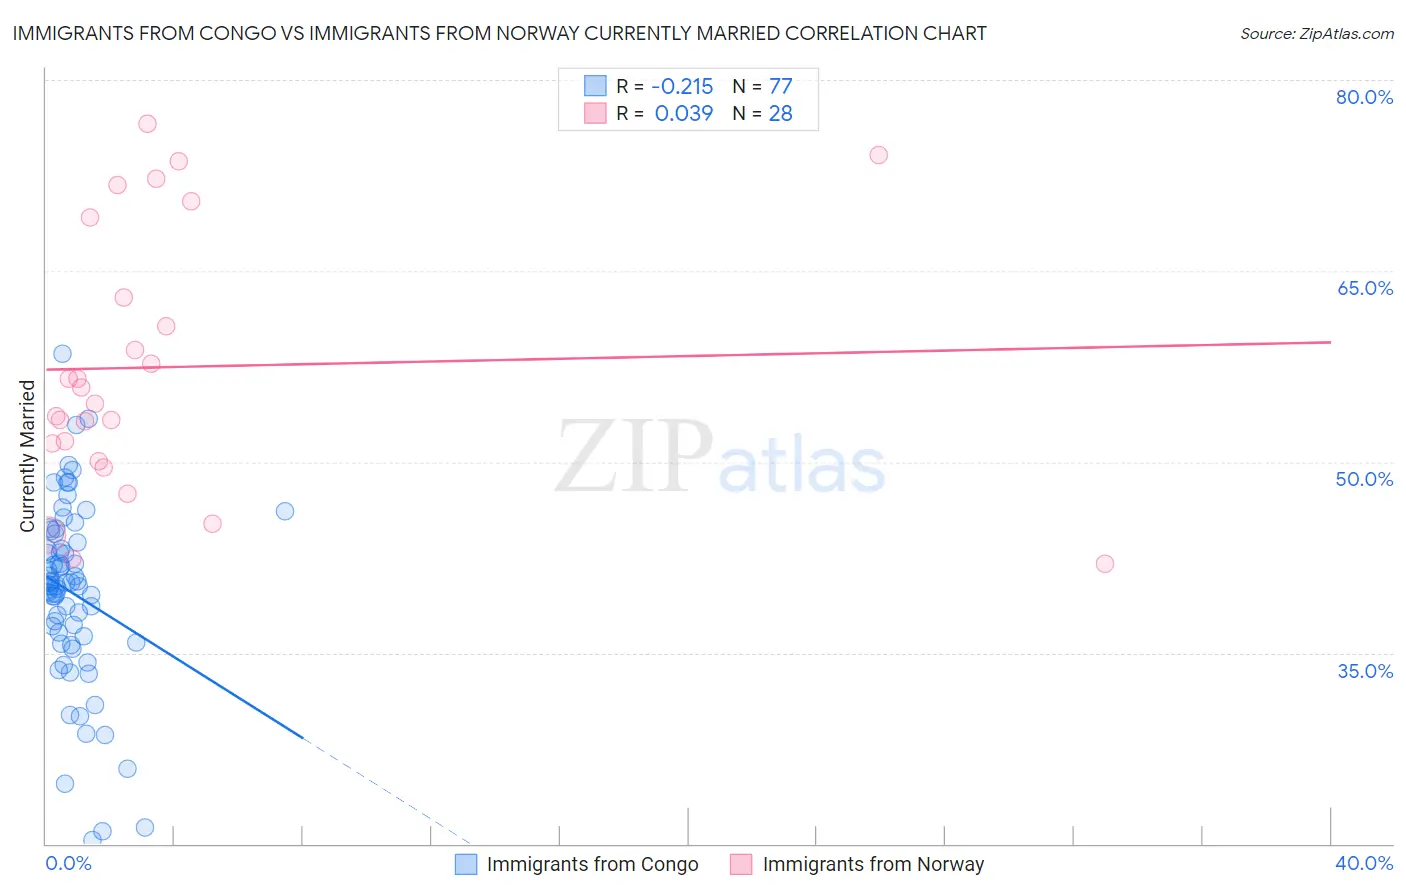
Immigrants from Congo vs Immigrants from Norway Currently Married Correlation Chart
The statistical analysis conducted on geographies consisting of 92,127,634 people shows a weak negative correlation between the proportion of Immigrants from Congo and percentage of population currently married in the United States with a correlation coefficient (R) of -0.215 and weighted average of 41.1%. Similarly, the statistical analysis conducted on geographies consisting of 116,715,182 people shows no correlation between the proportion of Immigrants from Norway and percentage of population currently married in the United States with a correlation coefficient (R) of 0.039 and weighted average of 47.2%, a difference of 15.0%.
Currently Married Correlation Summary
| Measurement | Immigrants from Congo | Immigrants from Norway |
| Minimum | 20.3% | 42.0% |
| Maximum | 58.5% | 76.6% |
| Range | 38.2% | 34.6% |
| Mean | 39.7% | 57.5% |
| Median | 40.3% | 55.2% |
| Interquartile 25% (IQ1) | 36.0% | 50.8% |
| Interquartile 75% (IQ3) | 44.0% | 66.0% |
| Interquartile Range (IQR) | 8.0% | 15.3% |
| Standard Deviation (Sample) | 7.2% | 10.2% |
| Standard Deviation (Population) | 7.2% | 10.1% |
Similar Demographics by Currently Married
Demographics Similar to Immigrants from Congo by Currently Married
In terms of currently married, the demographic groups most similar to Immigrants from Congo are Immigrants from Haiti (41.0%, a difference of 0.13%), Immigrants from Jamaica (41.1%, a difference of 0.23%), Immigrants from Somalia (41.2%, a difference of 0.29%), Bahamian (41.2%, a difference of 0.31%), and Haitian (41.3%, a difference of 0.49%).
| Demographics | Rating | Rank | Currently Married |
| West Indians | 0.0 /100 | #314 | Tragic 41.3% |
| Inupiat | 0.0 /100 | #315 | Tragic 41.3% |
| Immigrants | Caribbean | 0.0 /100 | #316 | Tragic 41.3% |
| Haitians | 0.0 /100 | #317 | Tragic 41.3% |
| Bahamians | 0.0 /100 | #318 | Tragic 41.2% |
| Immigrants | Somalia | 0.0 /100 | #319 | Tragic 41.2% |
| Immigrants | Jamaica | 0.0 /100 | #320 | Tragic 41.1% |
| Immigrants | Congo | 0.0 /100 | #321 | Tragic 41.1% |
| Immigrants | Haiti | 0.0 /100 | #322 | Tragic 41.0% |
| Immigrants | West Indies | 0.0 /100 | #323 | Tragic 40.7% |
| Immigrants | Senegal | 0.0 /100 | #324 | Tragic 40.7% |
| U.S. Virgin Islanders | 0.0 /100 | #325 | Tragic 40.7% |
| Barbadians | 0.0 /100 | #326 | Tragic 40.6% |
| Senegalese | 0.0 /100 | #327 | Tragic 40.6% |
| Arapaho | 0.0 /100 | #328 | Tragic 40.5% |
Demographics Similar to Immigrants from Norway by Currently Married
In terms of currently married, the demographic groups most similar to Immigrants from Norway are Immigrants from Malaysia (47.3%, a difference of 0.080%), Immigrants from Australia (47.3%, a difference of 0.080%), Immigrants from Vietnam (47.2%, a difference of 0.080%), Paraguayan (47.2%, a difference of 0.10%), and Pakistani (47.2%, a difference of 0.12%).
| Demographics | Rating | Rank | Currently Married |
| Portuguese | 84.2 /100 | #128 | Excellent 47.3% |
| Sri Lankans | 83.2 /100 | #129 | Excellent 47.3% |
| Immigrants | Iraq | 82.8 /100 | #130 | Excellent 47.3% |
| Icelanders | 82.4 /100 | #131 | Excellent 47.3% |
| Afghans | 81.8 /100 | #132 | Excellent 47.3% |
| Immigrants | Malaysia | 81.1 /100 | #133 | Excellent 47.3% |
| Immigrants | Australia | 81.1 /100 | #134 | Excellent 47.3% |
| Immigrants | Norway | 79.7 /100 | #135 | Good 47.2% |
| Immigrants | Vietnam | 78.2 /100 | #136 | Good 47.2% |
| Paraguayans | 77.8 /100 | #137 | Good 47.2% |
| Pakistanis | 77.5 /100 | #138 | Good 47.2% |
| Yugoslavians | 77.4 /100 | #139 | Good 47.2% |
| Cajuns | 75.3 /100 | #140 | Good 47.1% |
| Venezuelans | 74.4 /100 | #141 | Good 47.1% |
| Argentineans | 74.4 /100 | #142 | Good 47.1% |