Immigrants from Yemen vs Cypriot Average Family Size
COMPARE
Immigrants from Yemen
Cypriot
Average Family Size
Average Family Size Comparison
Immigrants from Yemen
Cypriots
3.60
AVERAGE FAMILY SIZE
100.0/ 100
METRIC RATING
8th/ 347
METRIC RANK
3.14
AVERAGE FAMILY SIZE
0.3/ 100
METRIC RATING
290th/ 347
METRIC RANK
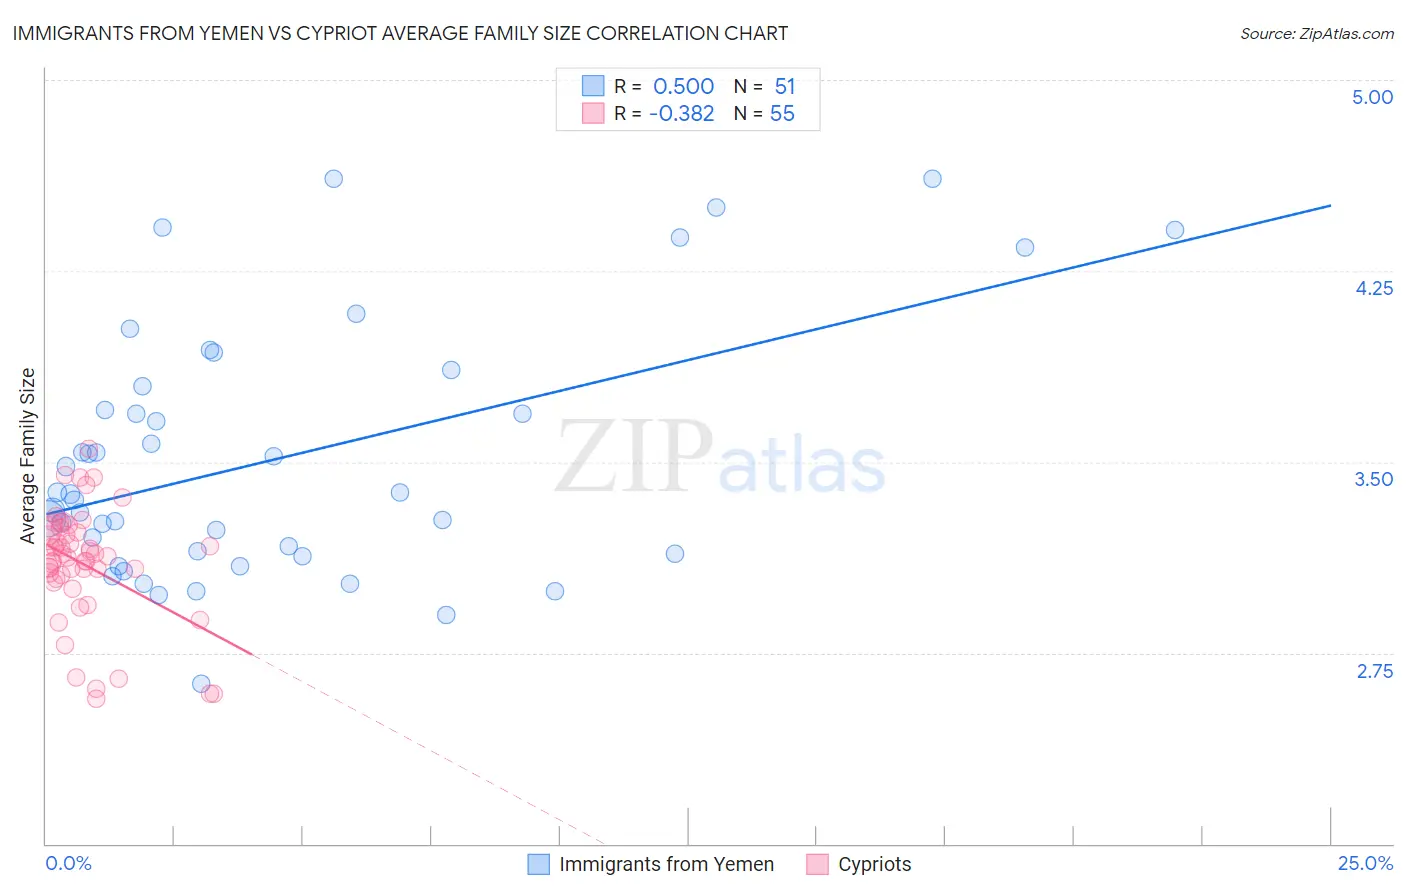
Immigrants from Yemen vs Cypriot Average Family Size Correlation Chart
The statistical analysis conducted on geographies consisting of 82,433,611 people shows a moderate positive correlation between the proportion of Immigrants from Yemen and average family size in the United States with a correlation coefficient (R) of 0.500 and weighted average of 3.60. Similarly, the statistical analysis conducted on geographies consisting of 61,854,678 people shows a mild negative correlation between the proportion of Cypriots and average family size in the United States with a correlation coefficient (R) of -0.382 and weighted average of 3.14, a difference of 14.5%.
Average Family Size Correlation Summary
| Measurement | Immigrants from Yemen | Cypriot |
| Minimum | 2.63 | 2.57 |
| Maximum | 4.61 | 3.55 |
| Range | 1.98 | 0.98 |
| Mean | 3.51 | 3.10 |
| Median | 3.37 | 3.13 |
| Interquartile 25% (IQ1) | 3.14 | 3.04 |
| Interquartile 75% (IQ3) | 3.80 | 3.23 |
| Interquartile Range (IQR) | 0.66 | 0.19 |
| Standard Deviation (Sample) | 0.49 | 0.22 |
| Standard Deviation (Population) | 0.49 | 0.22 |
Similar Demographics by Average Family Size
Demographics Similar to Immigrants from Yemen by Average Family Size
In terms of average family size, the demographic groups most similar to Immigrants from Yemen are Hopi (3.60, a difference of 0.010%), Spanish American Indian (3.58, a difference of 0.36%), Inupiat (3.63, a difference of 0.87%), Arapaho (3.64, a difference of 1.1%), and Navajo (3.65, a difference of 1.3%).
| Demographics | Rating | Rank | Average Family Size |
| Yup'ik | 100 /100 | #1 | Exceptional 4.00 |
| Crow | 100 /100 | #2 | Exceptional 3.82 |
| Pueblo | 100 /100 | #3 | Exceptional 3.79 |
| Pima | 100 /100 | #4 | Exceptional 3.75 |
| Navajo | 100.0 /100 | #5 | Exceptional 3.65 |
| Arapaho | 100.0 /100 | #6 | Exceptional 3.64 |
| Inupiat | 100.0 /100 | #7 | Exceptional 3.63 |
| Immigrants | Yemen | 100.0 /100 | #8 | Exceptional 3.60 |
| Hopi | 100.0 /100 | #9 | Exceptional 3.60 |
| Spanish American Indians | 100.0 /100 | #10 | Exceptional 3.58 |
| Tohono O'odham | 100.0 /100 | #11 | Exceptional 3.53 |
| Immigrants | Mexico | 100.0 /100 | #12 | Exceptional 3.52 |
| Sioux | 100.0 /100 | #13 | Exceptional 3.52 |
| Immigrants | Central America | 100.0 /100 | #14 | Exceptional 3.49 |
| Tongans | 100.0 /100 | #15 | Exceptional 3.49 |
Demographics Similar to Cypriots by Average Family Size
In terms of average family size, the demographic groups most similar to Cypriots are Greek (3.14, a difference of 0.030%), Immigrants from Czechoslovakia (3.14, a difference of 0.030%), Immigrants from Norway (3.14, a difference of 0.030%), Immigrants from Netherlands (3.14, a difference of 0.040%), and Alsatian (3.14, a difference of 0.040%).
| Demographics | Rating | Rank | Average Family Size |
| German Russians | 0.4 /100 | #283 | Tragic 3.15 |
| Immigrants | France | 0.4 /100 | #284 | Tragic 3.15 |
| Whites/Caucasians | 0.3 /100 | #285 | Tragic 3.14 |
| Immigrants | Netherlands | 0.3 /100 | #286 | Tragic 3.14 |
| Greeks | 0.3 /100 | #287 | Tragic 3.14 |
| Immigrants | Czechoslovakia | 0.3 /100 | #288 | Tragic 3.14 |
| Immigrants | Norway | 0.3 /100 | #289 | Tragic 3.14 |
| Cypriots | 0.3 /100 | #290 | Tragic 3.14 |
| Alsatians | 0.2 /100 | #291 | Tragic 3.14 |
| Europeans | 0.2 /100 | #292 | Tragic 3.14 |
| Scandinavians | 0.2 /100 | #293 | Tragic 3.14 |
| Immigrants | Croatia | 0.2 /100 | #294 | Tragic 3.14 |
| Austrians | 0.2 /100 | #295 | Tragic 3.14 |
| Ukrainians | 0.2 /100 | #296 | Tragic 3.14 |
| Immigrants | Western Europe | 0.2 /100 | #297 | Tragic 3.14 |