Immigrants from Canada vs Mexican American Indian Divorced or Separated
COMPARE
Immigrants from Canada
Mexican American Indian
Divorced or Separated
Divorced or Separated Comparison
Immigrants from Canada
Mexican American Indians
12.1%
DIVORCED OR SEPARATED
44.0/ 100
METRIC RATING
181st/ 347
METRIC RANK
12.0%
DIVORCED OR SEPARATED
55.8/ 100
METRIC RATING
170th/ 347
METRIC RANK
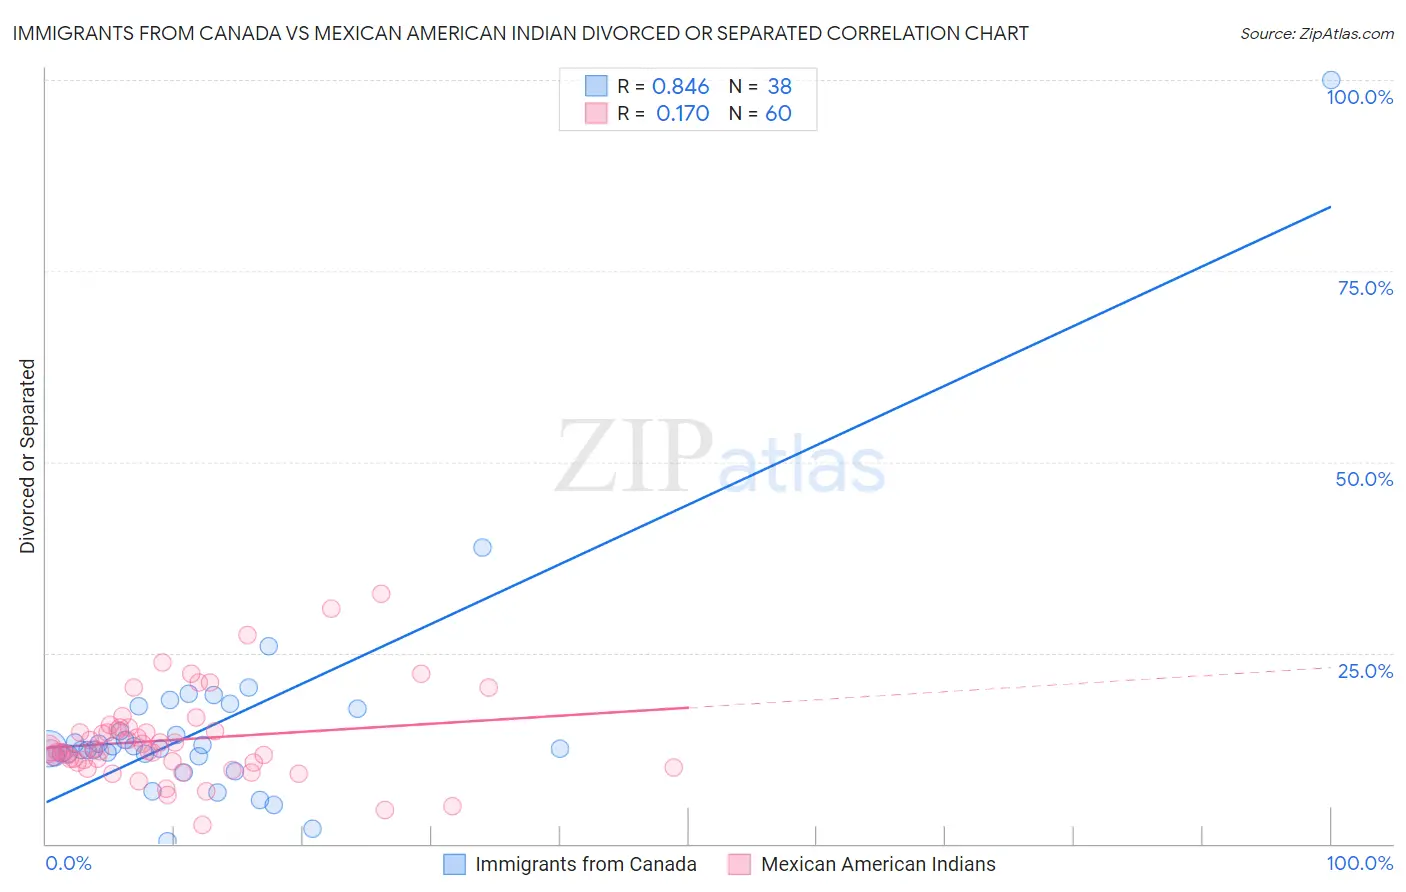
Immigrants from Canada vs Mexican American Indian Divorced or Separated Correlation Chart
The statistical analysis conducted on geographies consisting of 459,212,003 people shows a very strong positive correlation between the proportion of Immigrants from Canada and percentage of population currently divorced or separated in the United States with a correlation coefficient (R) of 0.846 and weighted average of 12.1%. Similarly, the statistical analysis conducted on geographies consisting of 317,554,193 people shows a poor positive correlation between the proportion of Mexican American Indians and percentage of population currently divorced or separated in the United States with a correlation coefficient (R) of 0.170 and weighted average of 12.0%, a difference of 0.41%.
Divorced or Separated Correlation Summary
| Measurement | Immigrants from Canada | Mexican American Indian |
| Minimum | 0.33% | 2.5% |
| Maximum | 100.0% | 32.8% |
| Range | 99.7% | 30.3% |
| Mean | 15.6% | 13.6% |
| Median | 12.5% | 12.2% |
| Interquartile 25% (IQ1) | 11.5% | 10.6% |
| Interquartile 75% (IQ3) | 17.6% | 15.0% |
| Interquartile Range (IQR) | 6.1% | 4.4% |
| Standard Deviation (Sample) | 15.5% | 5.8% |
| Standard Deviation (Population) | 15.3% | 5.8% |
Demographics Similar to Immigrants from Canada and Mexican American Indians by Divorced or Separated
In terms of divorced or separated, the demographic groups most similar to Immigrants from Canada are Barbadian (12.1%, a difference of 0.030%), Immigrants from Ethiopia (12.1%, a difference of 0.030%), Immigrants from Central America (12.1%, a difference of 0.040%), Immigrants from Western Europe (12.1%, a difference of 0.050%), and Ghanaian (12.1%, a difference of 0.060%). Similarly, the demographic groups most similar to Mexican American Indians are Serbian (12.0%, a difference of 0.040%), Immigrants from Peru (12.0%, a difference of 0.040%), Costa Rican (12.0%, a difference of 0.090%), Immigrants from Mexico (12.0%, a difference of 0.090%), and Ethiopian (12.0%, a difference of 0.10%).
| Demographics | Rating | Rank | Divorced or Separated |
| German Russians | 61.8 /100 | #165 | Good 12.0% |
| Tohono O'odham | 60.4 /100 | #166 | Good 12.0% |
| Ethiopians | 58.5 /100 | #167 | Average 12.0% |
| Serbians | 57.1 /100 | #168 | Average 12.0% |
| Immigrants | Peru | 57.0 /100 | #169 | Average 12.0% |
| Mexican American Indians | 55.8 /100 | #170 | Average 12.0% |
| Costa Ricans | 53.3 /100 | #171 | Average 12.0% |
| Immigrants | Mexico | 53.2 /100 | #172 | Average 12.0% |
| Immigrants | Moldova | 50.4 /100 | #173 | Average 12.1% |
| Hawaiians | 50.0 /100 | #174 | Average 12.1% |
| Immigrants | Sierra Leone | 50.0 /100 | #175 | Average 12.1% |
| Pennsylvania Germans | 48.9 /100 | #176 | Average 12.1% |
| Brazilians | 47.7 /100 | #177 | Average 12.1% |
| Ghanaians | 45.9 /100 | #178 | Average 12.1% |
| Immigrants | Western Europe | 45.6 /100 | #179 | Average 12.1% |
| Barbadians | 45.0 /100 | #180 | Average 12.1% |
| Immigrants | Canada | 44.0 /100 | #181 | Average 12.1% |
| Immigrants | Ethiopia | 43.1 /100 | #182 | Average 12.1% |
| Immigrants | Central America | 42.9 /100 | #183 | Average 12.1% |
| Immigrants | North America | 41.1 /100 | #184 | Average 12.1% |
| Immigrants | Nigeria | 40.5 /100 | #185 | Average 12.1% |