Lebanese vs Dutch Single Mother Households
COMPARE
Lebanese
Dutch
Single Mother Households
Single Mother Households Comparison
Lebanese
Dutch
5.9%
SINGLE MOTHER HOUSEHOLDS
92.4/ 100
METRIC RATING
127th/ 347
METRIC RANK
5.8%
SINGLE MOTHER HOUSEHOLDS
95.1/ 100
METRIC RATING
114th/ 347
METRIC RANK
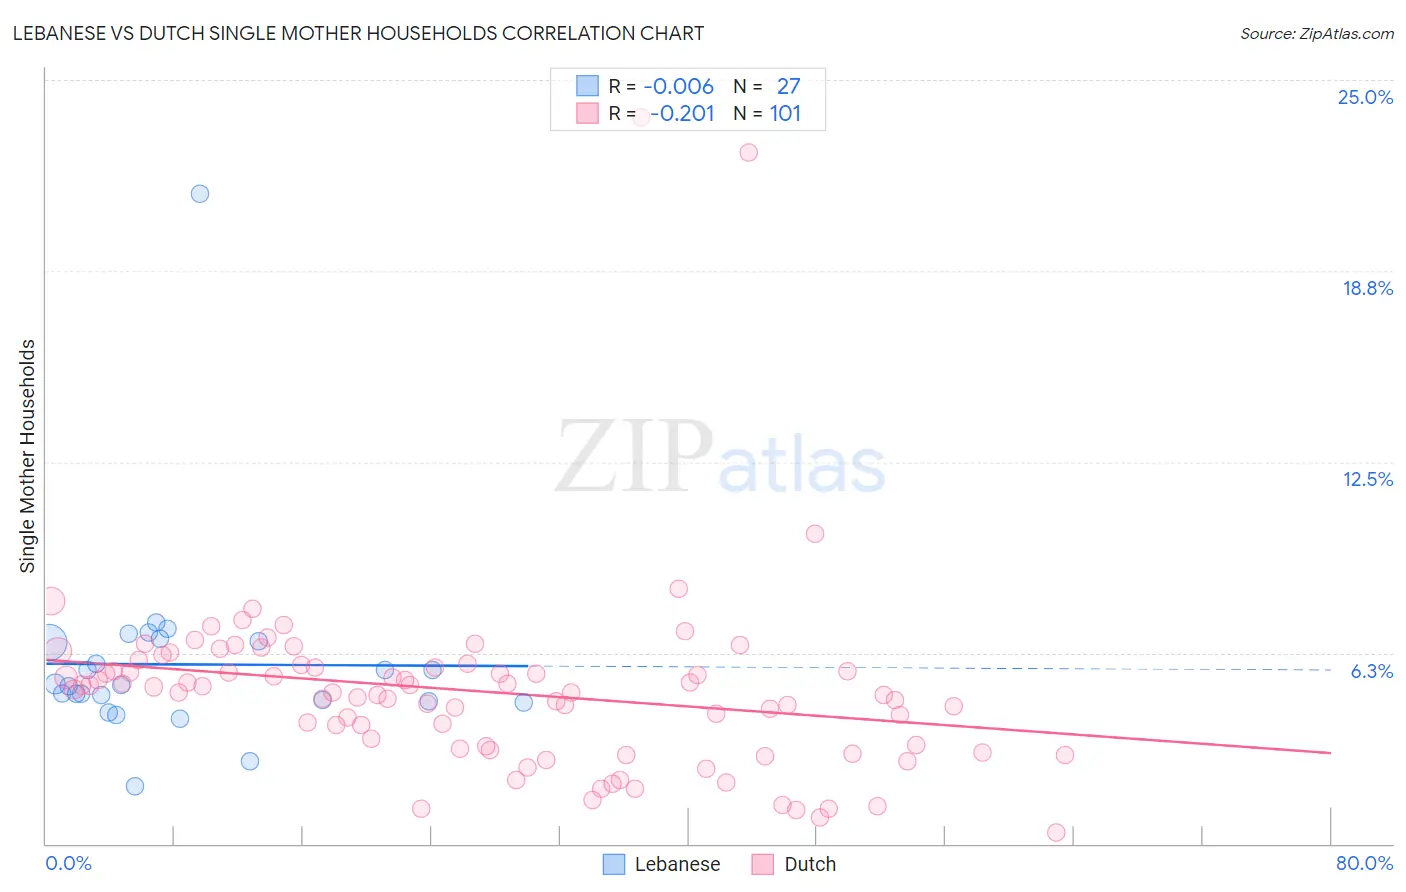
Lebanese vs Dutch Single Mother Households Correlation Chart
The statistical analysis conducted on geographies consisting of 400,403,260 people shows no correlation between the proportion of Lebanese and percentage of single mother households in the United States with a correlation coefficient (R) of -0.006 and weighted average of 5.9%. Similarly, the statistical analysis conducted on geographies consisting of 549,817,585 people shows a weak negative correlation between the proportion of Dutch and percentage of single mother households in the United States with a correlation coefficient (R) of -0.201 and weighted average of 5.8%, a difference of 1.4%.
Single Mother Households Correlation Summary
| Measurement | Lebanese | Dutch |
| Minimum | 1.9% | 0.36% |
| Maximum | 21.3% | 23.8% |
| Range | 19.4% | 23.4% |
| Mean | 5.9% | 5.0% |
| Median | 5.2% | 5.0% |
| Interquartile 25% (IQ1) | 4.6% | 3.1% |
| Interquartile 75% (IQ3) | 6.6% | 5.8% |
| Interquartile Range (IQR) | 2.0% | 2.7% |
| Standard Deviation (Sample) | 3.3% | 3.2% |
| Standard Deviation (Population) | 3.3% | 3.2% |
Demographics Similar to Lebanese and Dutch by Single Mother Households
In terms of single mother households, the demographic groups most similar to Lebanese are Czechoslovakian (5.9%, a difference of 0.080%), Immigrants from Bolivia (5.9%, a difference of 0.090%), Palestinian (5.9%, a difference of 0.12%), Welsh (5.9%, a difference of 0.19%), and Slavic (5.9%, a difference of 0.21%). Similarly, the demographic groups most similar to Dutch are Mongolian (5.8%, a difference of 0.13%), Irish (5.8%, a difference of 0.19%), Immigrants from Kuwait (5.8%, a difference of 0.20%), Immigrants from England (5.8%, a difference of 0.24%), and Pennsylvania German (5.8%, a difference of 0.25%).
| Demographics | Rating | Rank | Single Mother Households |
| British | 95.5 /100 | #110 | Exceptional 5.8% |
| Immigrants | England | 95.5 /100 | #111 | Exceptional 5.8% |
| Immigrants | Kuwait | 95.4 /100 | #112 | Exceptional 5.8% |
| Mongolians | 95.3 /100 | #113 | Exceptional 5.8% |
| Dutch | 95.1 /100 | #114 | Exceptional 5.8% |
| Irish | 94.8 /100 | #115 | Exceptional 5.8% |
| Pennsylvania Germans | 94.7 /100 | #116 | Exceptional 5.8% |
| Bolivians | 94.6 /100 | #117 | Exceptional 5.8% |
| Laotians | 94.3 /100 | #118 | Exceptional 5.8% |
| South Africans | 94.1 /100 | #119 | Exceptional 5.8% |
| Tongans | 93.7 /100 | #120 | Exceptional 5.8% |
| Argentineans | 93.7 /100 | #121 | Exceptional 5.8% |
| Belgians | 93.5 /100 | #122 | Exceptional 5.8% |
| Immigrants | Uzbekistan | 93.4 /100 | #123 | Exceptional 5.9% |
| Immigrants | Argentina | 93.2 /100 | #124 | Exceptional 5.9% |
| Slavs | 92.9 /100 | #125 | Exceptional 5.9% |
| Welsh | 92.8 /100 | #126 | Exceptional 5.9% |
| Lebanese | 92.4 /100 | #127 | Exceptional 5.9% |
| Czechoslovakians | 92.2 /100 | #128 | Exceptional 5.9% |
| Immigrants | Bolivia | 92.2 /100 | #129 | Exceptional 5.9% |
| Palestinians | 92.1 /100 | #130 | Exceptional 5.9% |