Icelander vs Immigrants from Scotland Average Family Size
COMPARE
Icelander
Immigrants from Scotland
Average Family Size
Average Family Size Comparison
Icelanders
Immigrants from Scotland
3.19
AVERAGE FAMILY SIZE
5.2/ 100
METRIC RATING
230th/ 347
METRIC RANK
3.12
AVERAGE FAMILY SIZE
0.1/ 100
METRIC RATING
315th/ 347
METRIC RANK
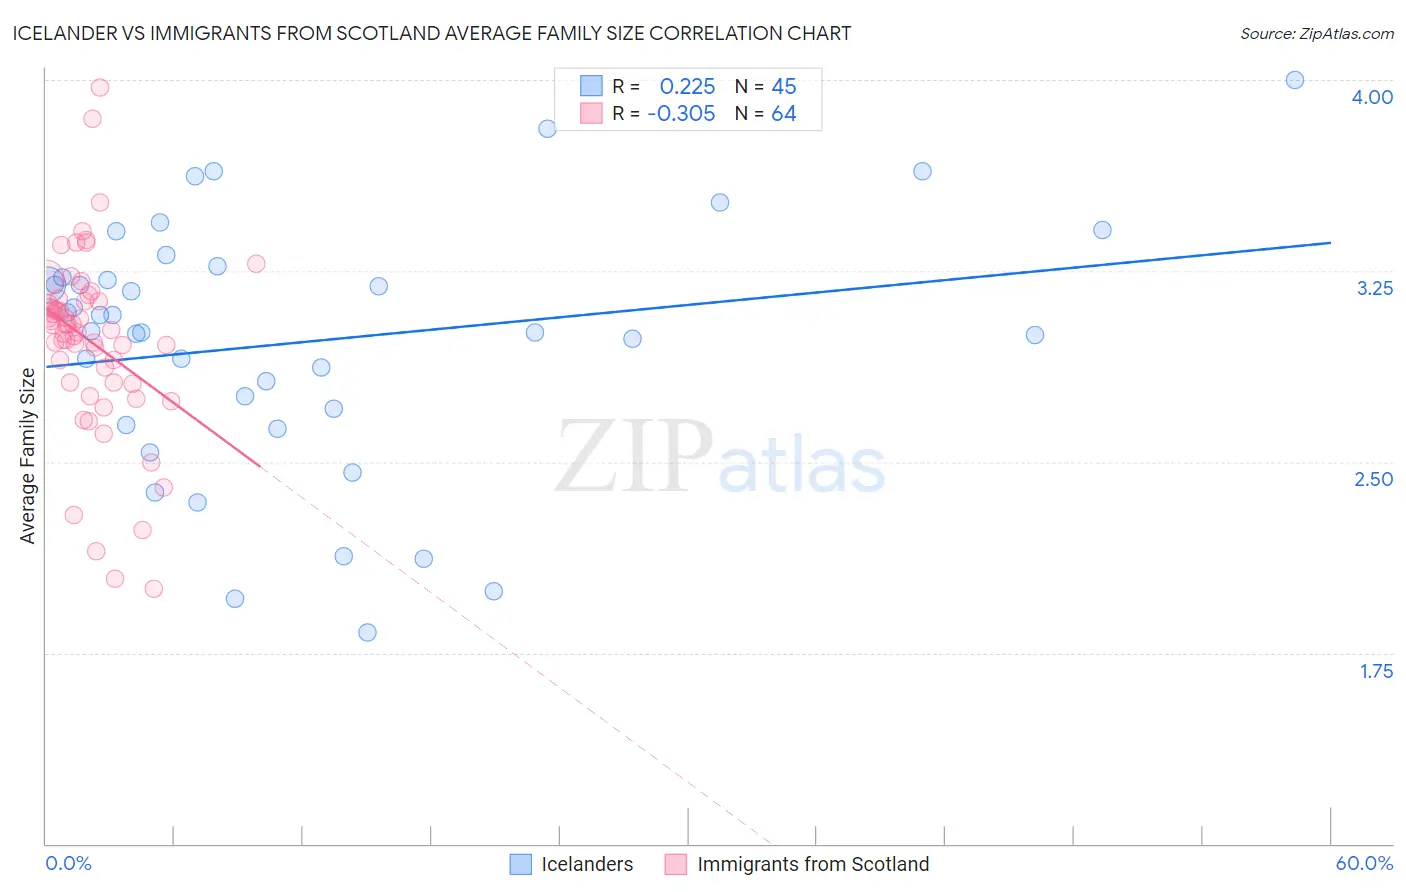
Icelander vs Immigrants from Scotland Average Family Size Correlation Chart
The statistical analysis conducted on geographies consisting of 159,626,444 people shows a weak positive correlation between the proportion of Icelanders and average family size in the United States with a correlation coefficient (R) of 0.225 and weighted average of 3.19. Similarly, the statistical analysis conducted on geographies consisting of 196,383,417 people shows a mild negative correlation between the proportion of Immigrants from Scotland and average family size in the United States with a correlation coefficient (R) of -0.305 and weighted average of 3.12, a difference of 2.0%.
Average Family Size Correlation Summary
| Measurement | Icelander | Immigrants from Scotland |
| Minimum | 1.83 | 2.00 |
| Maximum | 4.00 | 3.97 |
| Range | 2.17 | 1.97 |
| Mean | 2.97 | 2.97 |
| Median | 3.02 | 3.03 |
| Interquartile 25% (IQ1) | 2.68 | 2.81 |
| Interquartile 75% (IQ3) | 3.25 | 3.13 |
| Interquartile Range (IQR) | 0.57 | 0.32 |
| Standard Deviation (Sample) | 0.50 | 0.36 |
| Standard Deviation (Population) | 0.49 | 0.36 |
Similar Demographics by Average Family Size
Demographics Similar to Icelanders by Average Family Size
In terms of average family size, the demographic groups most similar to Icelanders are Basque (3.19, a difference of 0.0%), Immigrants from Italy (3.19, a difference of 0.010%), Cherokee (3.18, a difference of 0.040%), Nonimmigrants (3.19, a difference of 0.050%), and Portuguese (3.19, a difference of 0.070%).
| Demographics | Rating | Rank | Average Family Size |
| Immigrants | Zimbabwe | 7.1 /100 | #223 | Tragic 3.19 |
| Syrians | 6.5 /100 | #224 | Tragic 3.19 |
| Cree | 6.2 /100 | #225 | Tragic 3.19 |
| Chickasaw | 6.0 /100 | #226 | Tragic 3.19 |
| Portuguese | 6.0 /100 | #227 | Tragic 3.19 |
| Immigrants | Nonimmigrants | 5.7 /100 | #228 | Tragic 3.19 |
| Immigrants | Italy | 5.3 /100 | #229 | Tragic 3.19 |
| Icelanders | 5.2 /100 | #230 | Tragic 3.19 |
| Basques | 5.2 /100 | #231 | Tragic 3.19 |
| Cherokee | 4.7 /100 | #232 | Tragic 3.18 |
| Brazilians | 4.5 /100 | #233 | Tragic 3.18 |
| Iranians | 4.5 /100 | #234 | Tragic 3.18 |
| Immigrants | Turkey | 4.2 /100 | #235 | Tragic 3.18 |
| Immigrants | Portugal | 4.2 /100 | #236 | Tragic 3.18 |
| Immigrants | Romania | 3.7 /100 | #237 | Tragic 3.18 |
Demographics Similar to Immigrants from Scotland by Average Family Size
In terms of average family size, the demographic groups most similar to Immigrants from Scotland are Russian (3.12, a difference of 0.020%), Immigrants from Australia (3.13, a difference of 0.060%), Bulgarian (3.13, a difference of 0.060%), Immigrants from Northern Europe (3.13, a difference of 0.090%), and Serbian (3.12, a difference of 0.090%).
| Demographics | Rating | Rank | Average Family Size |
| Slavs | 0.1 /100 | #308 | Tragic 3.13 |
| Northern Europeans | 0.1 /100 | #309 | Tragic 3.13 |
| Czechoslovakians | 0.1 /100 | #310 | Tragic 3.13 |
| Immigrants | Northern Europe | 0.1 /100 | #311 | Tragic 3.13 |
| Immigrants | Australia | 0.1 /100 | #312 | Tragic 3.13 |
| Bulgarians | 0.1 /100 | #313 | Tragic 3.13 |
| Russians | 0.1 /100 | #314 | Tragic 3.12 |
| Immigrants | Scotland | 0.1 /100 | #315 | Tragic 3.12 |
| Serbians | 0.1 /100 | #316 | Tragic 3.12 |
| Italians | 0.1 /100 | #317 | Tragic 3.12 |
| Eastern Europeans | 0.1 /100 | #318 | Tragic 3.12 |
| Welsh | 0.1 /100 | #319 | Tragic 3.12 |
| Immigrants | North America | 0.0 /100 | #320 | Tragic 3.12 |
| Immigrants | Austria | 0.0 /100 | #321 | Tragic 3.12 |
| Immigrants | Canada | 0.0 /100 | #322 | Tragic 3.12 |