Bermudan vs Immigrants from Scotland Average Family Size
COMPARE
Bermudan
Immigrants from Scotland
Average Family Size
Average Family Size Comparison
Bermudans
Immigrants from Scotland
3.20
AVERAGE FAMILY SIZE
11.0/ 100
METRIC RATING
216th/ 347
METRIC RANK
3.12
AVERAGE FAMILY SIZE
0.1/ 100
METRIC RATING
315th/ 347
METRIC RANK
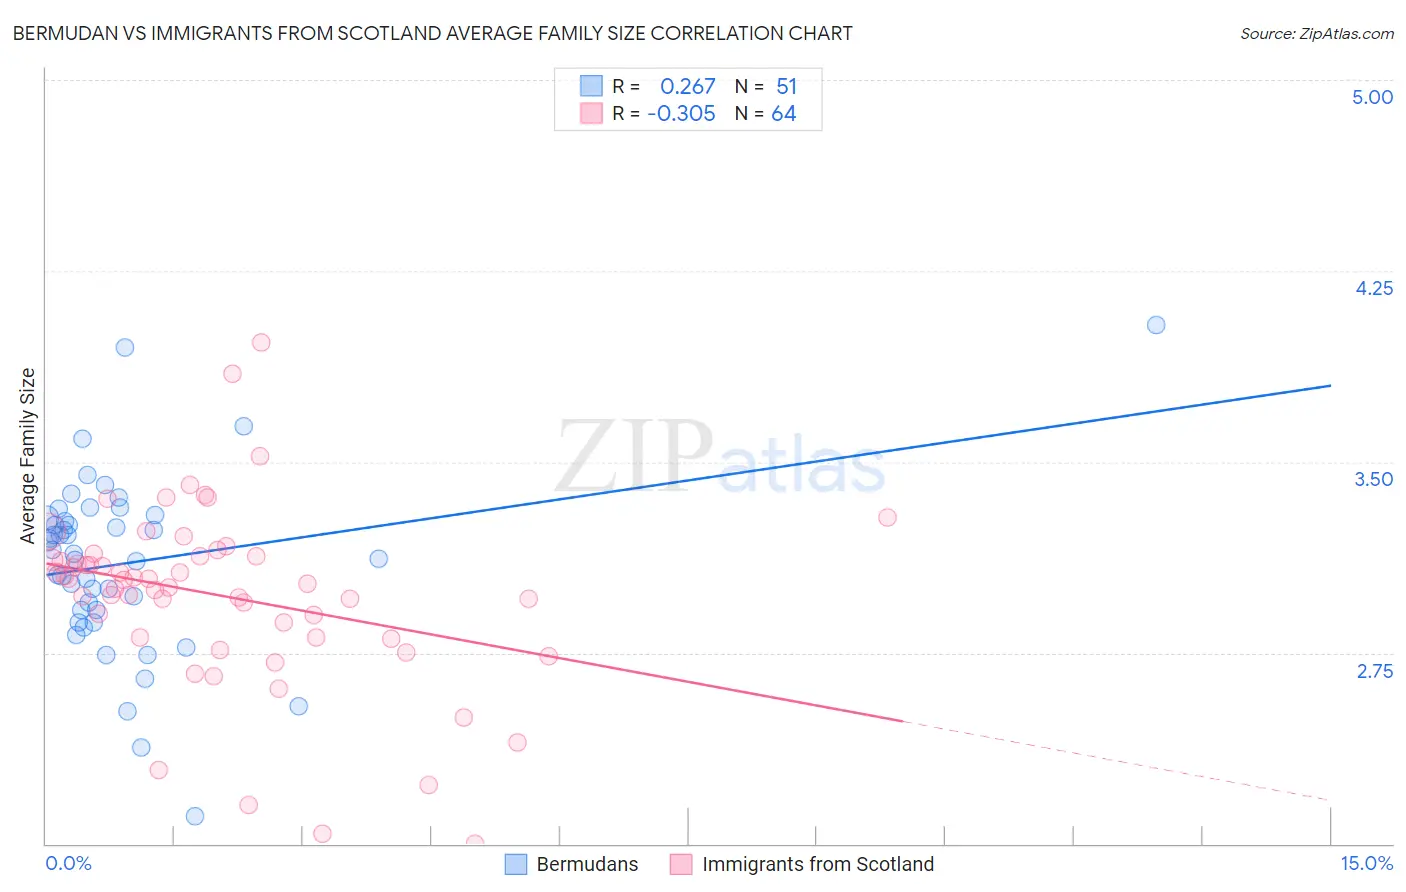
Bermudan vs Immigrants from Scotland Average Family Size Correlation Chart
The statistical analysis conducted on geographies consisting of 55,716,155 people shows a weak positive correlation between the proportion of Bermudans and average family size in the United States with a correlation coefficient (R) of 0.267 and weighted average of 3.20. Similarly, the statistical analysis conducted on geographies consisting of 196,383,417 people shows a mild negative correlation between the proportion of Immigrants from Scotland and average family size in the United States with a correlation coefficient (R) of -0.305 and weighted average of 3.12, a difference of 2.4%.
Average Family Size Correlation Summary
| Measurement | Bermudan | Immigrants from Scotland |
| Minimum | 2.11 | 2.00 |
| Maximum | 4.04 | 3.97 |
| Range | 1.93 | 1.97 |
| Mean | 3.10 | 2.97 |
| Median | 3.14 | 3.03 |
| Interquartile 25% (IQ1) | 2.92 | 2.81 |
| Interquartile 75% (IQ3) | 3.28 | 3.13 |
| Interquartile Range (IQR) | 0.36 | 0.32 |
| Standard Deviation (Sample) | 0.35 | 0.36 |
| Standard Deviation (Population) | 0.34 | 0.36 |
Similar Demographics by Average Family Size
Demographics Similar to Bermudans by Average Family Size
In terms of average family size, the demographic groups most similar to Bermudans are Delaware (3.20, a difference of 0.0%), Somali (3.20, a difference of 0.010%), Mongolian (3.20, a difference of 0.030%), Immigrants from Somalia (3.20, a difference of 0.030%), and Immigrants from Iran (3.20, a difference of 0.050%).
| Demographics | Rating | Rank | Average Family Size |
| Sudanese | 13.3 /100 | #209 | Poor 3.20 |
| Zimbabweans | 12.6 /100 | #210 | Poor 3.20 |
| Immigrants | Iran | 12.1 /100 | #211 | Poor 3.20 |
| Creek | 12.1 /100 | #212 | Poor 3.20 |
| Mongolians | 11.5 /100 | #213 | Poor 3.20 |
| Somalis | 11.2 /100 | #214 | Poor 3.20 |
| Delaware | 11.1 /100 | #215 | Poor 3.20 |
| Bermudans | 11.0 /100 | #216 | Poor 3.20 |
| Immigrants | Somalia | 10.3 /100 | #217 | Poor 3.20 |
| French American Indians | 9.8 /100 | #218 | Tragic 3.20 |
| Pennsylvania Germans | 9.3 /100 | #219 | Tragic 3.19 |
| Lebanese | 9.1 /100 | #220 | Tragic 3.19 |
| Immigrants | Ukraine | 7.2 /100 | #221 | Tragic 3.19 |
| Immigrants | Kuwait | 7.2 /100 | #222 | Tragic 3.19 |
| Immigrants | Zimbabwe | 7.1 /100 | #223 | Tragic 3.19 |
Demographics Similar to Immigrants from Scotland by Average Family Size
In terms of average family size, the demographic groups most similar to Immigrants from Scotland are Russian (3.12, a difference of 0.020%), Immigrants from Australia (3.13, a difference of 0.060%), Bulgarian (3.13, a difference of 0.060%), Immigrants from Northern Europe (3.13, a difference of 0.090%), and Serbian (3.12, a difference of 0.090%).
| Demographics | Rating | Rank | Average Family Size |
| Slavs | 0.1 /100 | #308 | Tragic 3.13 |
| Northern Europeans | 0.1 /100 | #309 | Tragic 3.13 |
| Czechoslovakians | 0.1 /100 | #310 | Tragic 3.13 |
| Immigrants | Northern Europe | 0.1 /100 | #311 | Tragic 3.13 |
| Immigrants | Australia | 0.1 /100 | #312 | Tragic 3.13 |
| Bulgarians | 0.1 /100 | #313 | Tragic 3.13 |
| Russians | 0.1 /100 | #314 | Tragic 3.12 |
| Immigrants | Scotland | 0.1 /100 | #315 | Tragic 3.12 |
| Serbians | 0.1 /100 | #316 | Tragic 3.12 |
| Italians | 0.1 /100 | #317 | Tragic 3.12 |
| Eastern Europeans | 0.1 /100 | #318 | Tragic 3.12 |
| Welsh | 0.1 /100 | #319 | Tragic 3.12 |
| Immigrants | North America | 0.0 /100 | #320 | Tragic 3.12 |
| Immigrants | Austria | 0.0 /100 | #321 | Tragic 3.12 |
| Immigrants | Canada | 0.0 /100 | #322 | Tragic 3.12 |