Immigrants from the Azores vs White/Caucasian Family Households with Children
COMPARE
Immigrants from the Azores
White/Caucasian
Family Households with Children
Family Households with Children Comparison
Immigrants from the Azores
Whites/Caucasians
28.1%
FAMILY HOUSEHOLDS WITH CHILDREN
98.8/ 100
METRIC RATING
99th/ 347
METRIC RANK
27.4%
FAMILY HOUSEHOLDS WITH CHILDREN
50.0/ 100
METRIC RATING
174th/ 347
METRIC RANK
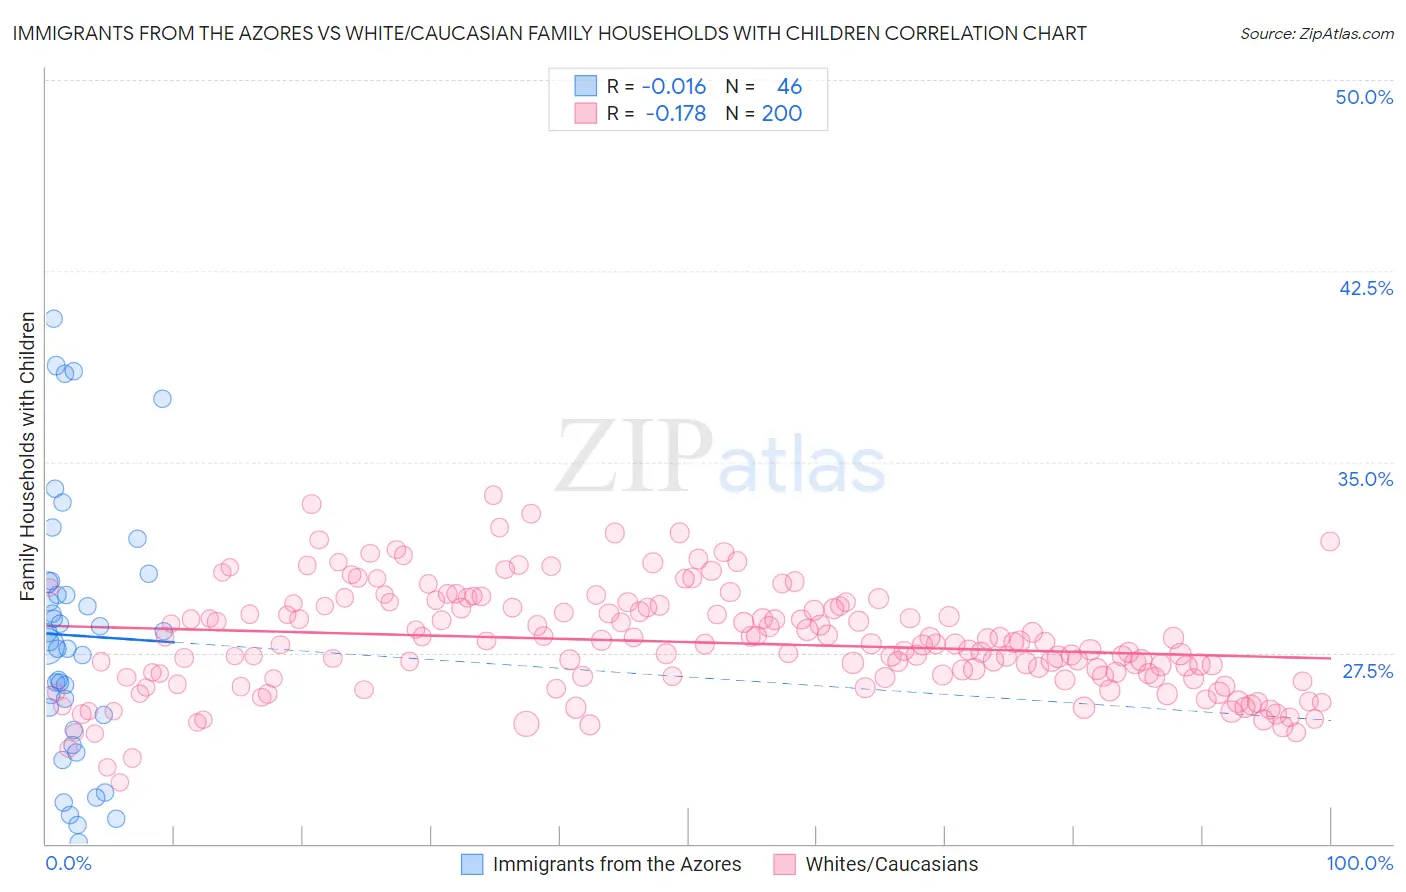
Immigrants from the Azores vs White/Caucasian Family Households with Children Correlation Chart
The statistical analysis conducted on geographies consisting of 46,253,049 people shows no correlation between the proportion of Immigrants from the Azores and percentage of family households with children in the United States with a correlation coefficient (R) of -0.016 and weighted average of 28.1%. Similarly, the statistical analysis conducted on geographies consisting of 583,762,337 people shows a poor negative correlation between the proportion of Whites/Caucasians and percentage of family households with children in the United States with a correlation coefficient (R) of -0.178 and weighted average of 27.4%, a difference of 2.4%.
Family Households with Children Correlation Summary
| Measurement | Immigrants from the Azores | White/Caucasian |
| Minimum | 20.0% | 22.4% |
| Maximum | 40.6% | 33.7% |
| Range | 20.6% | 11.3% |
| Mean | 28.2% | 27.9% |
| Median | 27.8% | 27.8% |
| Interquartile 25% (IQ1) | 25.0% | 26.5% |
| Interquartile 75% (IQ3) | 30.3% | 29.3% |
| Interquartile Range (IQR) | 5.2% | 2.8% |
| Standard Deviation (Sample) | 5.1% | 2.1% |
| Standard Deviation (Population) | 5.0% | 2.1% |
Similar Demographics by Family Households with Children
Demographics Similar to Immigrants from the Azores by Family Households with Children
In terms of family households with children, the demographic groups most similar to Immigrants from the Azores are Indonesian (28.1%, a difference of 0.0%), Immigrants from Kenya (28.1%, a difference of 0.010%), Immigrants from Oceania (28.1%, a difference of 0.020%), Chilean (28.1%, a difference of 0.050%), and Assyrian/Chaldean/Syriac (28.1%, a difference of 0.050%).
| Demographics | Rating | Rank | Family Households with Children |
| Chickasaw | 99.4 /100 | #92 | Exceptional 28.2% |
| Panamanians | 99.3 /100 | #93 | Exceptional 28.2% |
| Immigrants | Colombia | 99.2 /100 | #94 | Exceptional 28.2% |
| Immigrants | Nicaragua | 99.1 /100 | #95 | Exceptional 28.2% |
| Ute | 99.1 /100 | #96 | Exceptional 28.2% |
| Chileans | 98.9 /100 | #97 | Exceptional 28.1% |
| Immigrants | Kenya | 98.9 /100 | #98 | Exceptional 28.1% |
| Immigrants | Azores | 98.8 /100 | #99 | Exceptional 28.1% |
| Indonesians | 98.8 /100 | #100 | Exceptional 28.1% |
| Immigrants | Oceania | 98.8 /100 | #101 | Exceptional 28.1% |
| Assyrians/Chaldeans/Syriacs | 98.7 /100 | #102 | Exceptional 28.1% |
| Palestinians | 98.5 /100 | #103 | Exceptional 28.1% |
| Sioux | 98.3 /100 | #104 | Exceptional 28.1% |
| Choctaw | 98.3 /100 | #105 | Exceptional 28.1% |
| Immigrants | South America | 98.0 /100 | #106 | Exceptional 28.0% |
Demographics Similar to Whites/Caucasians by Family Households with Children
In terms of family households with children, the demographic groups most similar to Whites/Caucasians are British (27.4%, a difference of 0.0%), Immigrants from China (27.4%, a difference of 0.010%), Ugandan (27.4%, a difference of 0.020%), Spanish American (27.4%, a difference of 0.020%), and Immigrants from Argentina (27.5%, a difference of 0.050%).
| Demographics | Rating | Rank | Family Households with Children |
| Dominicans | 61.1 /100 | #167 | Good 27.5% |
| Immigrants | Kuwait | 60.9 /100 | #168 | Good 27.5% |
| Seminole | 56.9 /100 | #169 | Average 27.5% |
| Cherokee | 56.7 /100 | #170 | Average 27.5% |
| Blackfeet | 54.3 /100 | #171 | Average 27.5% |
| Israelis | 53.9 /100 | #172 | Average 27.5% |
| Immigrants | Argentina | 52.2 /100 | #173 | Average 27.5% |
| Whites/Caucasians | 50.0 /100 | #174 | Average 27.4% |
| British | 49.9 /100 | #175 | Average 27.4% |
| Immigrants | China | 49.6 /100 | #176 | Average 27.4% |
| Ugandans | 49.2 /100 | #177 | Average 27.4% |
| Spanish Americans | 48.9 /100 | #178 | Average 27.4% |
| Turks | 46.9 /100 | #179 | Average 27.4% |
| Immigrants | Turkey | 46.9 /100 | #180 | Average 27.4% |
| Aleuts | 46.7 /100 | #181 | Average 27.4% |