Immigrants from Austria vs Panamanian Family Households
COMPARE
Immigrants from Austria
Panamanian
Family Households
Family Households Comparison
Immigrants from Austria
Panamanians
63.1%
FAMILY HOUSEHOLDS
0.3/ 100
METRIC RATING
270th/ 347
METRIC RANK
64.8%
FAMILY HOUSEHOLDS
92.4/ 100
METRIC RATING
126th/ 347
METRIC RANK
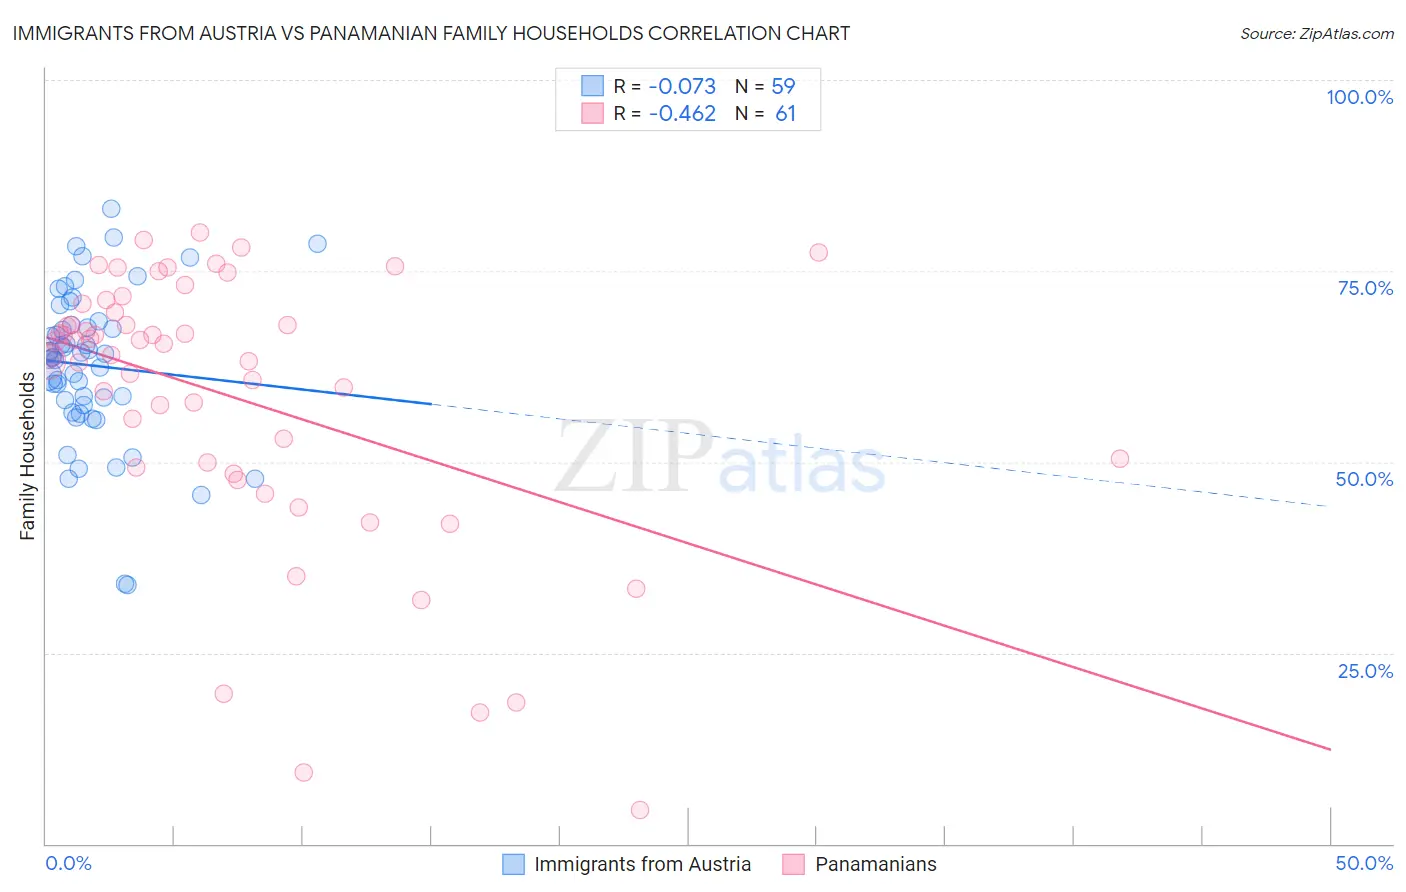
Immigrants from Austria vs Panamanian Family Households Correlation Chart
The statistical analysis conducted on geographies consisting of 167,966,875 people shows a slight negative correlation between the proportion of Immigrants from Austria and percentage of family households in the United States with a correlation coefficient (R) of -0.073 and weighted average of 63.1%. Similarly, the statistical analysis conducted on geographies consisting of 281,073,089 people shows a moderate negative correlation between the proportion of Panamanians and percentage of family households in the United States with a correlation coefficient (R) of -0.462 and weighted average of 64.8%, a difference of 2.8%.
Family Households Correlation Summary
| Measurement | Immigrants from Austria | Panamanian |
| Minimum | 33.9% | 4.4% |
| Maximum | 83.1% | 80.0% |
| Range | 49.2% | 75.6% |
| Mean | 62.6% | 58.6% |
| Median | 63.7% | 65.5% |
| Interquartile 25% (IQ1) | 57.4% | 49.5% |
| Interquartile 75% (IQ3) | 67.9% | 70.1% |
| Interquartile Range (IQR) | 10.5% | 20.6% |
| Standard Deviation (Sample) | 10.0% | 17.8% |
| Standard Deviation (Population) | 10.0% | 17.7% |
Similar Demographics by Family Households
Demographics Similar to Immigrants from Austria by Family Households
In terms of family households, the demographic groups most similar to Immigrants from Austria are Immigrants from Croatia (63.1%, a difference of 0.010%), Immigrants from Turkey (63.1%, a difference of 0.010%), Immigrants from Singapore (63.1%, a difference of 0.020%), Yugoslavian (63.1%, a difference of 0.020%), and Immigrants from Kazakhstan (63.1%, a difference of 0.020%).
| Demographics | Rating | Rank | Family Households |
| Cheyenne | 0.5 /100 | #263 | Tragic 63.2% |
| Kenyans | 0.5 /100 | #264 | Tragic 63.2% |
| Colville | 0.5 /100 | #265 | Tragic 63.2% |
| Immigrants | Western Africa | 0.5 /100 | #266 | Tragic 63.1% |
| Israelis | 0.4 /100 | #267 | Tragic 63.1% |
| Immigrants | Singapore | 0.4 /100 | #268 | Tragic 63.1% |
| Yugoslavians | 0.4 /100 | #269 | Tragic 63.1% |
| Immigrants | Austria | 0.3 /100 | #270 | Tragic 63.1% |
| Immigrants | Croatia | 0.3 /100 | #271 | Tragic 63.1% |
| Immigrants | Turkey | 0.3 /100 | #272 | Tragic 63.1% |
| Immigrants | Kazakhstan | 0.3 /100 | #273 | Tragic 63.1% |
| Lumbee | 0.3 /100 | #274 | Tragic 63.1% |
| West Indians | 0.3 /100 | #275 | Tragic 63.1% |
| Serbians | 0.3 /100 | #276 | Tragic 63.0% |
| Ottawa | 0.3 /100 | #277 | Tragic 63.0% |
Demographics Similar to Panamanians by Family Households
In terms of family households, the demographic groups most similar to Panamanians are Immigrants from Argentina (64.9%, a difference of 0.020%), Immigrants from Belize (64.9%, a difference of 0.020%), Immigrants from Panama (64.8%, a difference of 0.020%), Italian (64.8%, a difference of 0.020%), and Hmong (64.9%, a difference of 0.050%).
| Demographics | Rating | Rank | Family Households |
| Immigrants | Eastern Asia | 94.4 /100 | #119 | Exceptional 64.9% |
| Immigrants | Oceania | 94.2 /100 | #120 | Exceptional 64.9% |
| Hungarians | 94.0 /100 | #121 | Exceptional 64.9% |
| Hmong | 93.4 /100 | #122 | Exceptional 64.9% |
| Choctaw | 93.4 /100 | #123 | Exceptional 64.9% |
| Immigrants | Argentina | 92.8 /100 | #124 | Exceptional 64.9% |
| Immigrants | Belize | 92.7 /100 | #125 | Exceptional 64.9% |
| Panamanians | 92.4 /100 | #126 | Exceptional 64.8% |
| Immigrants | Panama | 92.0 /100 | #127 | Exceptional 64.8% |
| Italians | 91.9 /100 | #128 | Exceptional 64.8% |
| Immigrants | Ecuador | 91.4 /100 | #129 | Exceptional 64.8% |
| Immigrants | Italy | 90.2 /100 | #130 | Exceptional 64.8% |
| Immigrants | Nonimmigrants | 90.1 /100 | #131 | Exceptional 64.8% |
| Cajuns | 89.4 /100 | #132 | Excellent 64.8% |
| Belizeans | 89.3 /100 | #133 | Excellent 64.8% |