Immigrants from Australia vs Australian Single Father Households
COMPARE
Immigrants from Australia
Australian
Single Father Households
Single Father Households Comparison
Immigrants from Australia
Australians
2.0%
SINGLE FATHER HOUSEHOLDS
100.0/ 100
METRIC RATING
34th/ 347
METRIC RANK
2.2%
SINGLE FATHER HOUSEHOLDS
97.7/ 100
METRIC RATING
120th/ 347
METRIC RANK
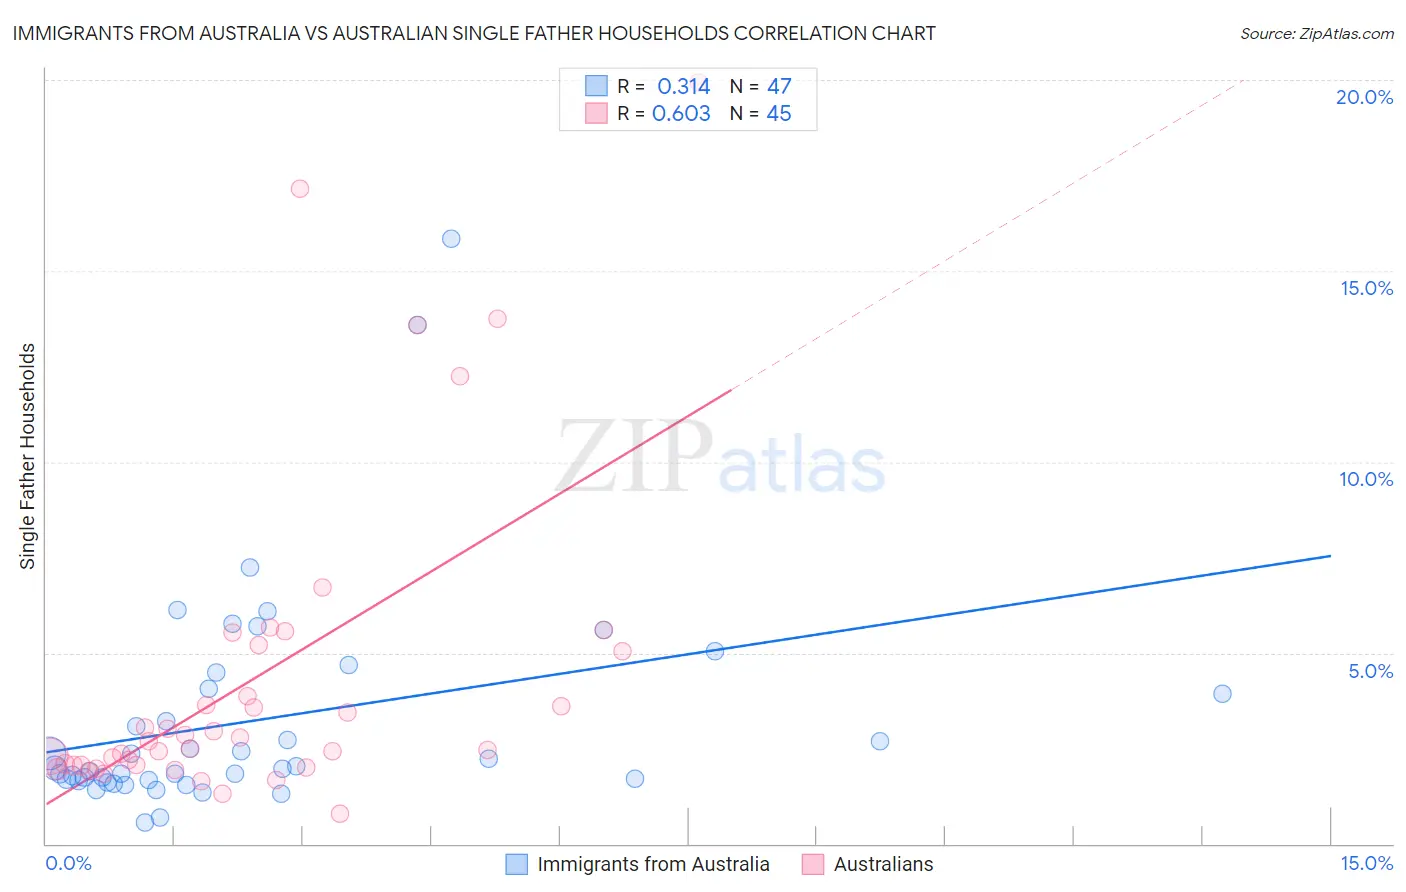
Immigrants from Australia vs Australian Single Father Households Correlation Chart
The statistical analysis conducted on geographies consisting of 225,821,838 people shows a mild positive correlation between the proportion of Immigrants from Australia and percentage of single father households in the United States with a correlation coefficient (R) of 0.314 and weighted average of 2.0%. Similarly, the statistical analysis conducted on geographies consisting of 222,691,289 people shows a significant positive correlation between the proportion of Australians and percentage of single father households in the United States with a correlation coefficient (R) of 0.603 and weighted average of 2.2%, a difference of 10.1%.
Single Father Households Correlation Summary
| Measurement | Immigrants from Australia | Australian |
| Minimum | 0.57% | 0.78% |
| Maximum | 15.8% | 19.9% |
| Range | 15.3% | 19.2% |
| Mean | 3.2% | 4.3% |
| Median | 2.0% | 2.7% |
| Interquartile 25% (IQ1) | 1.7% | 2.0% |
| Interquartile 75% (IQ3) | 4.1% | 5.1% |
| Interquartile Range (IQR) | 2.4% | 3.1% |
| Standard Deviation (Sample) | 2.9% | 4.3% |
| Standard Deviation (Population) | 2.9% | 4.2% |
Similar Demographics by Single Father Households
Demographics Similar to Immigrants from Australia by Single Father Households
In terms of single father households, the demographic groups most similar to Immigrants from Australia are Turkish (2.0%, a difference of 0.020%), Chinese (2.0%, a difference of 0.23%), Israeli (2.0%, a difference of 0.28%), Cambodian (2.0%, a difference of 0.31%), and Albanian (2.0%, a difference of 0.32%).
| Demographics | Rating | Rank | Single Father Households |
| Immigrants | South Central Asia | 100.0 /100 | #27 | Exceptional 2.0% |
| Immigrants | Japan | 100.0 /100 | #28 | Exceptional 2.0% |
| Bulgarians | 100.0 /100 | #29 | Exceptional 2.0% |
| Cambodians | 100.0 /100 | #30 | Exceptional 2.0% |
| Israelis | 100.0 /100 | #31 | Exceptional 2.0% |
| Chinese | 100.0 /100 | #32 | Exceptional 2.0% |
| Turks | 100.0 /100 | #33 | Exceptional 2.0% |
| Immigrants | Australia | 100.0 /100 | #34 | Exceptional 2.0% |
| Albanians | 100.0 /100 | #35 | Exceptional 2.0% |
| Immigrants | Belgium | 100.0 /100 | #36 | Exceptional 2.0% |
| Immigrants | St. Vincent and the Grenadines | 100.0 /100 | #37 | Exceptional 2.0% |
| Immigrants | Eastern Europe | 100.0 /100 | #38 | Exceptional 2.0% |
| Immigrants | Sri Lanka | 100.0 /100 | #39 | Exceptional 2.0% |
| Immigrants | Bulgaria | 100.0 /100 | #40 | Exceptional 2.0% |
| Immigrants | Turkey | 100.0 /100 | #41 | Exceptional 2.0% |
Demographics Similar to Australians by Single Father Households
In terms of single father households, the demographic groups most similar to Australians are Immigrants from Brazil (2.2%, a difference of 0.0%), Trinidadian and Tobagonian (2.2%, a difference of 0.030%), Immigrants from Morocco (2.2%, a difference of 0.090%), Immigrants from Iraq (2.2%, a difference of 0.10%), and Hungarian (2.2%, a difference of 0.19%).
| Demographics | Rating | Rank | Single Father Households |
| Iraqis | 98.2 /100 | #113 | Exceptional 2.2% |
| Immigrants | North America | 98.2 /100 | #114 | Exceptional 2.2% |
| Immigrants | Barbados | 98.2 /100 | #115 | Exceptional 2.2% |
| Immigrants | Argentina | 98.1 /100 | #116 | Exceptional 2.2% |
| Hungarians | 97.9 /100 | #117 | Exceptional 2.2% |
| Immigrants | Morocco | 97.8 /100 | #118 | Exceptional 2.2% |
| Trinidadians and Tobagonians | 97.8 /100 | #119 | Exceptional 2.2% |
| Australians | 97.7 /100 | #120 | Exceptional 2.2% |
| Immigrants | Brazil | 97.7 /100 | #121 | Exceptional 2.2% |
| Immigrants | Iraq | 97.6 /100 | #122 | Exceptional 2.2% |
| Immigrants | Yemen | 97.5 /100 | #123 | Exceptional 2.2% |
| British West Indians | 97.4 /100 | #124 | Exceptional 2.2% |
| Immigrants | Indonesia | 97.4 /100 | #125 | Exceptional 2.2% |
| Moroccans | 96.9 /100 | #126 | Exceptional 2.2% |
| Jordanians | 96.9 /100 | #127 | Exceptional 2.2% |